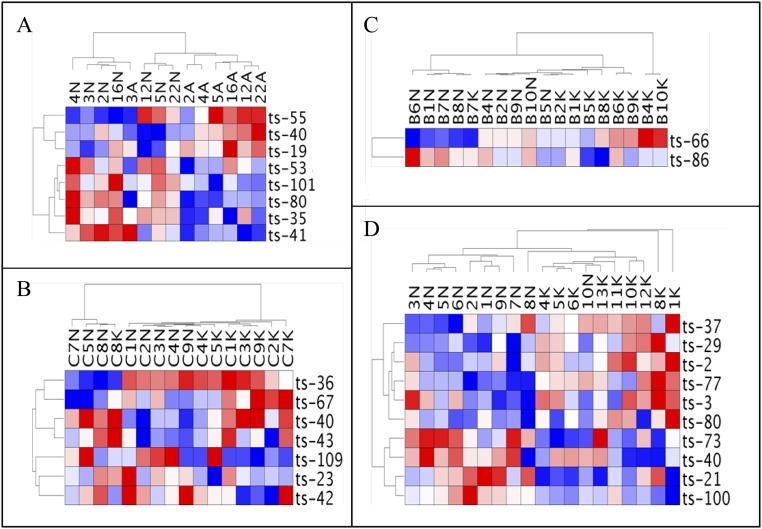
Fig. S1.
(A) Heat map of the tsRNA signature generated with data from paired samples from colon adenoma patients. (B) Heat map of the tsRNA signature generated with data from paired samples from colon adenocarcinoma patients. (C) Heat map of the tsRNA signature generated with data from paired samples from breast cancer patients. (D) Heat map of the tsRNA signature generated with data from samples from ovary cancer patients and normal ovary tissues from controls.

