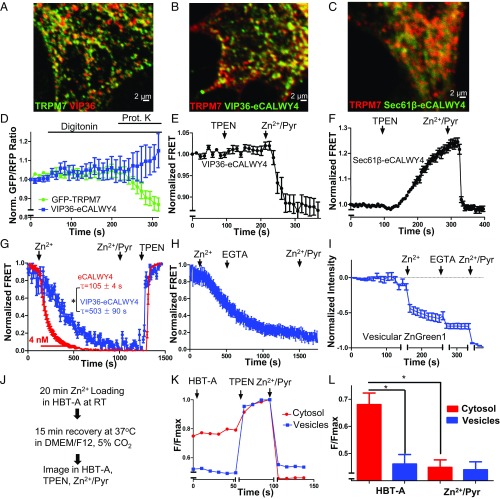
Fig. 5.
Zn2+ sequestration by M7Vs in intact cells. (A) Colocalization of VIP36-V5 and TRPM7-HA in HEK293 cells. (B) Colocalization of immunostained VIP36-eCALWY4 intravesicular Zn2+ sensor and TRPM7-HA in HEK293 cells. (C) Lack of colocalization of ER-targeted eCALWY4 and TRPM7-HA. (D) ER lumen-targeted RCEPIA1er was coexpressed with cytosol-facing GFP (located on the N terminus of TRPM7) or VIP36-eCALWY4. Then the plasma membrane was permeabilized with 20 µM digitonin, and proteinase K was added to digest cytosolic fluorescent proteins. ER lumen-targeted RCEPIA1er was used as a proteinase K-inaccessible control. (E) HEK293 cells expressing VIP36-eCALWY4 were incubated with 50 µM TPEN or 50 µM Zn2+/20 µM pyrithione. Shown are means and SEMs of seven cells in more than four representative time-course experiments. (F) eCALWY4 was targeted into the ER lumen using Sec61β, and cells were imaged in 50 µM TPEN or 50 µM Zn2+/20 µM pyrithione. Shown are the mean and SEM of seven cells in a representative time-course experiment. (G) HEK293 cells were transfected with either VIP36-eCALWY4 or eCALWY4 cDNA and then were incubated with 500 µM Zn2+, followed by 50 µM Zn2+/20 µM pyrithione and TPEN. Shown are time constants of Zn2+ entry and 95% CIs of 10–12 cells representative of multiple similar experiments; *P < 0.0001 after an extra sum of squares F-test comparison of the two curves. (H) Vesicular Zn2+ loading was initiated with 500 µM extracellular Zn2+, which then was replaced with 250 µM EGTA to chelate Zn2+. The mean and SEM of data from 19 cells from three experiments are plotted. (I) Cells expressing TRPM7 (ZnGreen1 inserted between the S1 and S2 domains of TRPM7) were perfused with Zn2+ and EGTA as in H. Plots show means and SEMs of cells from one experiment representative of more than three; axis breaks are 5 min. (J) The method for loading and releasing Zn2+ from M7Vs with luminal ZnGreen1. (K and L) After cytosolic and M7V-luminal ZnGreen1 were saturated with Zn2+ and cells were allowed to extrude cytosolic Zn2+ as described in J, residual cytosolic and vesicular Zn2+ were imaged in 50 µM HBT-A or 50 µM TPEN Zn2+/20 µM pyrithione. *P < 0.05, ANOVA after Tukey’s multiple comparison test of 24–36 cells from three experiments. See also Figs. S2–S5 and Dataset S1.

