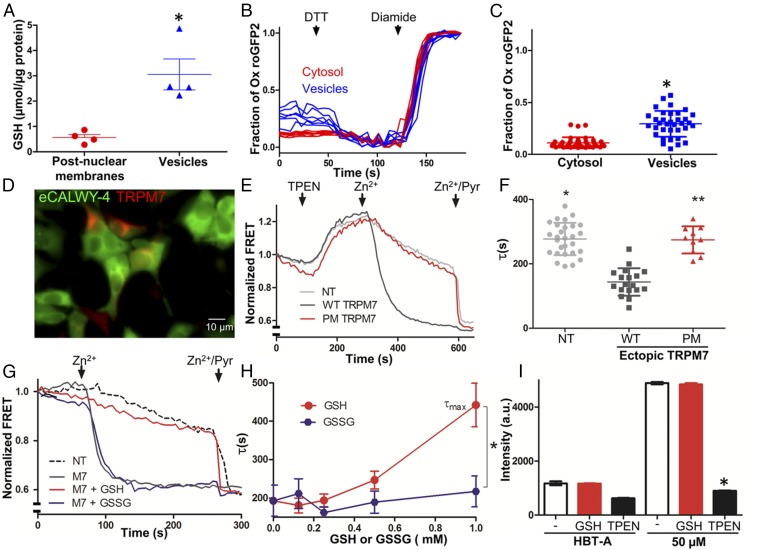
Fig. 6.
Regulation of TRPM7-mediated Zn2+ entry by the glutathione redox state. (A) Luciferase assay of GSH in postnuclear membranes and M7Vs purified from ES cells expressing HA-tagged endogenous TRPM7. The mean and SD of four replicates are plotted and compared by Student’s t test; *P < 0.01. (B and C) Cytosolic or intravesicular roGFP2 was maximally reduced with 10 mM DTT and maximally oxidized with 1 mM diamide in HBT-A. *P < 0.001 by Student’s t test, n = 35–42 cells. (D) HEK293 cells expressing eCALWY4 without (green only) or with mCherry-TRPM7 (green and red). (E) Time-course of Zn2+ entry into nontransfected HEK293 cells (NT, gray line), HEK293 cells overexpressing WT mCherry-TRPM7 (WT, black line), or loss-of-function pore-mutant mCherry-TRPM7 (PM, red line). After baseline imaging in HBT-A, cells were perfused with the Zn2+ chelator TPEN, followed by 50 µM Zn2+ and 50 µM Zn2+/20 µM pyrithione (Zn2+/Pyr) at the time points indicated by black arrows. (F) Time constants of Zn2+ entry into nontransfected and TRPM7-overexpressing HEK293 cells. Means and SD are plotted along with results of ANOVA with Kruskal–Wallis post test; asterisks indicate P < 0.05 compared with WT TRPM7-transfected cells. (G) Comparison of the effects of GSH (red line) and GSSG (purple line) on Zn2+ entry into HEK293 cells expressing eCALWY4 without (dashed line) or with (solid lines) mCherry-TRPM7. (H) Dose-dependence of GSH/GSSG effects on Zn2+ entry. τmax is the maximum time constant for Zn2+ entry (no inhibition); n = 3–10 cells; error bars indicate SEM. *P < 0.001. (I) Responses of Calcium Green-1 (low-affinity Zn2+ indicator), to Zn2+ in 100 µM TPEN or 1 mM GSH. The means and SEMs of three to six replicates are plotted; *P < 0.05 by ANOVA followed by a Kruskal–Wallis post test; a.u., arbitrary units. See Figs. S6 and S7 and Dataset S2.

