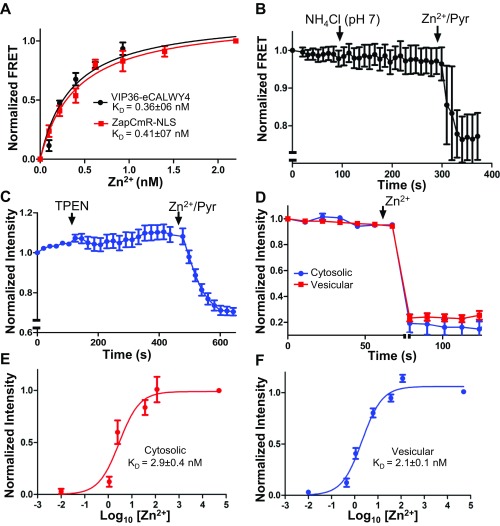
Fig. S5.
(Related to Fig. 5) Characterization of genetically encoded Zn2+ sensors. (A) Vesicular and nuclear Zn2+ were monitored concurrently in a mixture of HEK293 cells expressing VIP36-eCALWY4 or ZapCmR2-NLS and titrated with increasing Zn2+ concentrations in 20 µM pyrithione. (B) VIP36-eCALWY4 FRET was monitored in HEK293 cells before and after neutralization of vesicular pH with NH4Cl. (C) HEK293 cells expressing intravesicular ZnGreen1 (in the TRPM7 S1/2 loop) were incubated with 50 µM TPEN or 50 µM Zn2+/20 µM pyrithione. (D) Cytosolic and vesicular ZnGreen1 sensors were saturated (indicated by the axis break) 20 min after loading with 500 µM extracellular Zn2+ at room temperature. (E and F) Cytosolic (E) and vesicular (F) ZnGreen1 were titrated with increasing concentrations of Zn2+ in 20 µM pyrithione to determine Zn2+ affinities of the sensors. The Kds of the TRPM7-conjugated sensors (21–2.9 nM) indicate higher affinity than that reported for the naked sensor (633 nM) (51). Note: We have inverted eCALWY-4 FRET changes to overlay the calibration curve of eCALWY-4 and that of a conventional FRET-based sensor (ZapCmR2) in Fig. S5A. To keep the panels consistent, intensity changes of ZnGreen1 were also inverted.

