Figure 5.

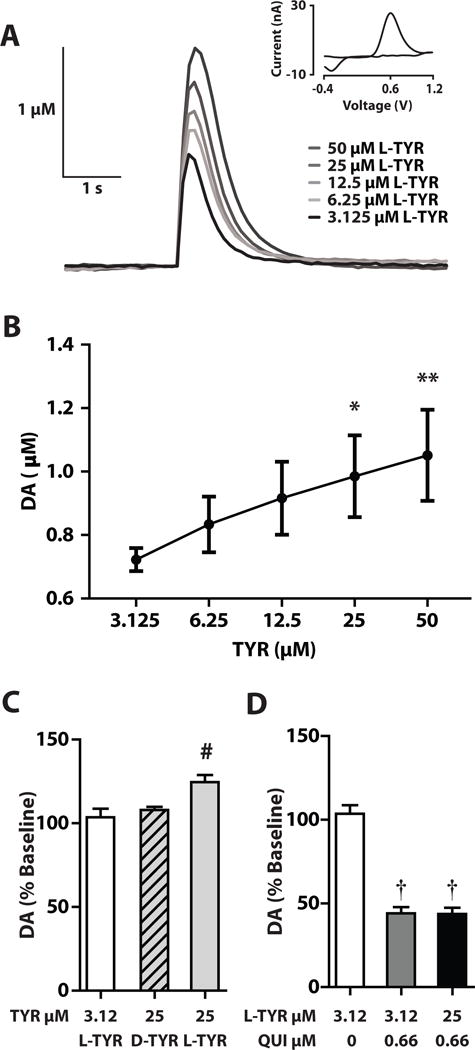
Tyrosine (TYR) effects on striatal DA levels ex vivo. (A) Traces of stimulated DA from striatal slices following bath application of increasing concentrations of L-TYR with inset cyclic voltammogram. (B) Peak stimulated DA levels after incremental increases in L-TYR. (C) Peak stimulated DA (% baseline) after L-TYR 3.125 μM, L-TYR 25 μM or D-TYR 25 μM. (D) Peak stimulated DA(% baseline) after quinpirole (QUI) 0.66 μM alone or with L-TYR 25 μM. (Mean ± SEM, n = 5 per group). Significantly different from TYR 3.125 μM (* p < 0.05, ** p < 0.01). Significantly different from other groups, a, (* p < 0.05). Significantly different from baseline, († p < 0.05). Mean ± SEM. n = 5/group.
