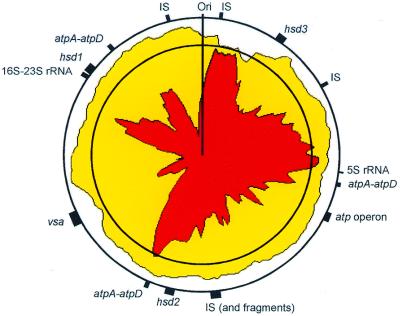
Figure 2.
Density of coding sequences along the M.pulmonis chromosome. Yellow indicates the density of coding sequences in both strands of the sequence and red the density of the coding sequences in the clockwise strand (published sequence). This density was calculated with a sliding window of 50 kb. The first circle represents 100%, the second (inner circle) is 80%. The positions of rRNA genes and of other genes discussed in the text are indicated by black boxes.

