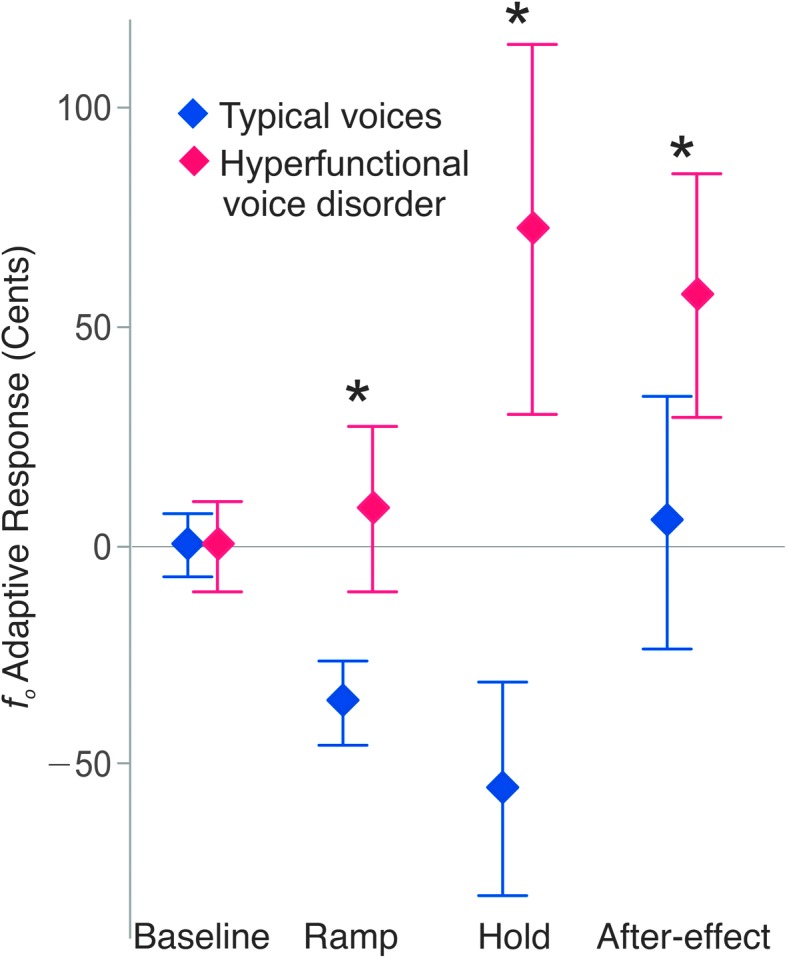
Figure 2.

Average adaptive responses of each group as a function of experimental phase. Error bars: 95% confidence intervals. Speakers with hyperfunctional voice disorders had significantly higher adaptive responses (p adj ≤ .001) than speakers with typical voices.
