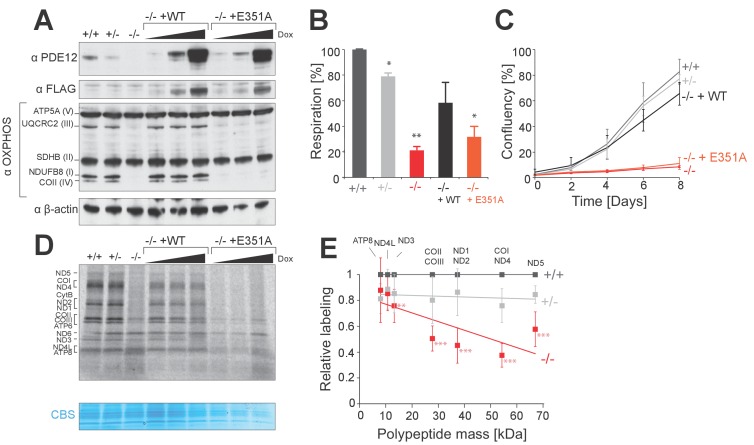
Figure 1. PDE12 is essential for efficient mitochondrial translation.
(A) Western blotting for steady-state levels of OxPhos components in PDE12+/+, PDE12 ± and PDE12−/− cells, and in PDE12−/− expressing either wild-type PDE12 or the E351A catalytic mutant at increasing expression levels. (B) Basal oxygen consumption of PDE12+/+ and PDE12−/− cells, and PDE12−/− cells expressing either wild-type PDE12 or E351A. Mean values ± SEM are shown, n = 3. *p<0.05, ***p<0.001 with Student t-test relative to PDE12+/+. (p values: [+/+] vs. [+/−] p=0.0141; [+/+] vs. [−/−] p=0.00134; [+/+] vs. [−/− + WT] p=0.12; [+/+] vs. [−/− + E351A] p=0.0144). (C) Growth curve of PDE12+/+, PDE12+/− and PDE12−/− cells, and PDE12−/− cells expressing either PDE12 wild-type or E351A cultured in DMEM containing 0.9 g/L galactose. Representative experiment is shown where each cell line was plated in quadruplicate (mean ± 1 SD). (D) Metabolic labelling of mitochondrial translation products with [35S]-methionine in PDE12+/+, PDE12+/− and PDE12−/− cells, and in PDE12−/− cells expressing either wild-type PDE12 or E351A for 24 hr at increasing levels. CBS: Coomassie blue stained gel as loading control. (E) Quantification of a subset of mitochondrial translation products in PDE12+/− and PDE12−/− relative to PDE12+/+using ImageQuant software. Relative quantification for each polypeptide was plotted against expected length of polypeptide. For COII/III, ND1/ND2 and COI/ND4 products were quantified together due to proximity of their bands on the gel, and plotted mass is the mean average of both proteins (mean ± SD; n = 6, for PDE12+/− n = 3, **p<0.01, ***p<0.001). (p values: [+/+] vs. [+/−]: ATP8 p=0.148, ND4L p=0.407, ND3 p=0.299, COX2/COX3 p=0.263, ND1/ND2 p=0.397, COX1/ND4 p=0.12124, ND5 p=0.08528; [+/+] vs. [+/+]: ATP8 p=0.328, ND4L p=0.058, ND3 p=0.00857, COX2/COX3 p=9.21×10⁻⁵, ND1/ND2 p=0.00029, COX1/ND4 p=2.08×10⁻⁵, ND5 p=0.00016.


