. 2017 Jul 26;6:e27596. doi: 10.7554/eLife.27596

Figure 4. A subset of mt-tRNAs are affected by spurious 3’ adenylation in the absence of PDE12, leading to reduced aminoacylation of specific mt-tRNAs.

(A) Schematic of mt-tRNA structure depicting 3' extension determined via the radioactive MPAT (b) and MPAT-Seq (c). DB, discriminator base (B) Radioactive MPAT assay for a subset of mt-tRNAs extracted from PDE12+/+ and PDE12−/−. MPAT assay gel profiles were determined using ImageQuant. (C) Representation of 3’ ends of a subset of mt-tRNAs from PDE12+/+ and PDE12−/−, ascertained by MPAT-Seq. Read count shown for each position is relative to the read count for the corresponding discriminator base (DB) for each mt-tRNA. (D) Box-plot representation of percentage of mt-tRNAs molecules extended beyond the 3' CCA addition for all 22 mt-tRNAs, ascertained by MPAT-Seq, for PDE12+/+ and PDE12−/− cells, and in PDE12−/− cells expressing either wild-type PDE12 or E351A for 24 hr. **p<0.01, ***p<0.001 with Student t-test relative to PDE12+/+. (p values: [+/+] vs. [−/−] p=0.0089, [+/+] vs. [−/− + WT] p=0.83, [+/+] vs [−/− + E351A] p=2.14×10⁻⁷). (E) Aminoacylation assay for subset of mt-tRNAs for PDE12+/+ and PDE12−/−. Profiles of aminoacylated mt-tRNAs were determined using ImageQuant. dAAc indicates intentionally deacylated samples.

DOI: http://dx.doi.org/10.7554/eLife.27596.008

Figure 4—source data 1. Read count for mitochondrial poly(A) (MPAT) next generation RNA sequencing (MPAT-Seq).
DOI: 10.7554/eLife.27596.009

Figure 4.

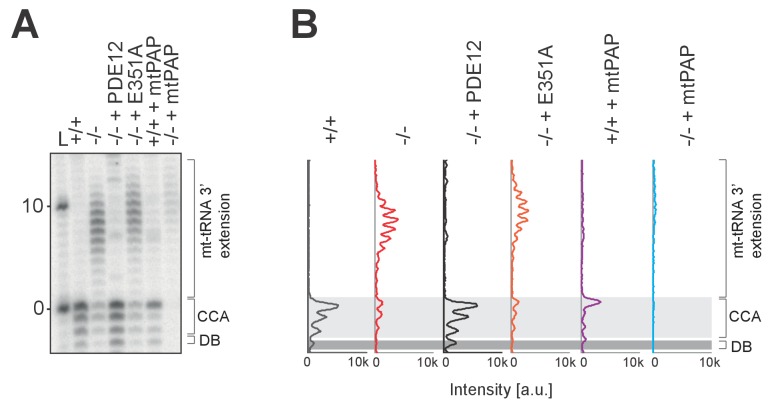
Figure 4—figure supplement 1. Radioactive MPAT assay for mt-tRNALys.

Figure 4—figure supplement 1.

(A) Radioactive MPAT assay for mt-tRNALys for PDE12+/+, PDE12−/−, PDE12−/− cell lines expressing PDE12 wild-type cDNA or E351A, and PDE12+/+ and PDE12−/− expressing mtPAP. (B) Quantification of MPAT gel profiles shown in (A) using ImageQuant.
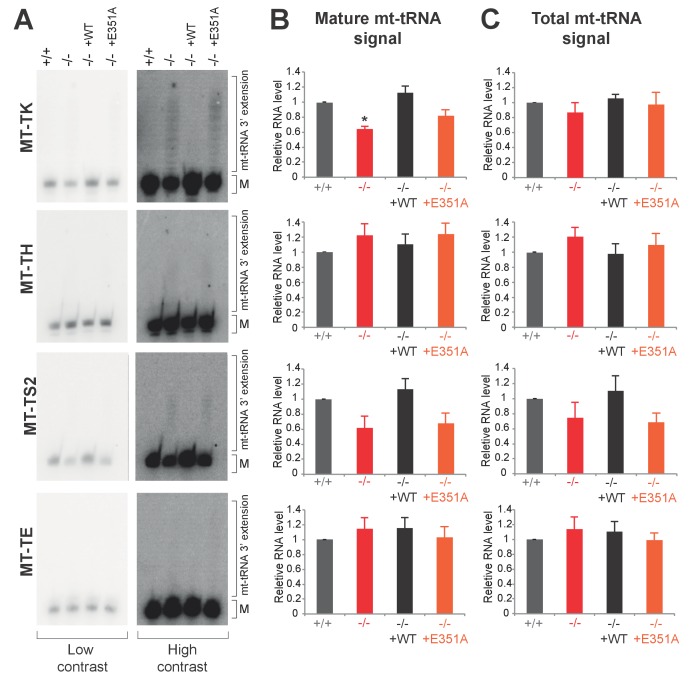
Figure 4—figure supplement 2. Northern blotting for mt-tRNAs.

Figure 4—figure supplement 2.

(A) High-resolution northern blots for indicated mt-tRNAs for PDE12+/+, PDE12−/−, PDE12−/− cell lines expressing PDE12 wild-type cDNA or E351A. M indicates mature mt-tRNA species. (B) and (C) Quantification of the northern blot signal for mature mt-tRNA (B) and total signal from a given lane (C) using ImageQuant.
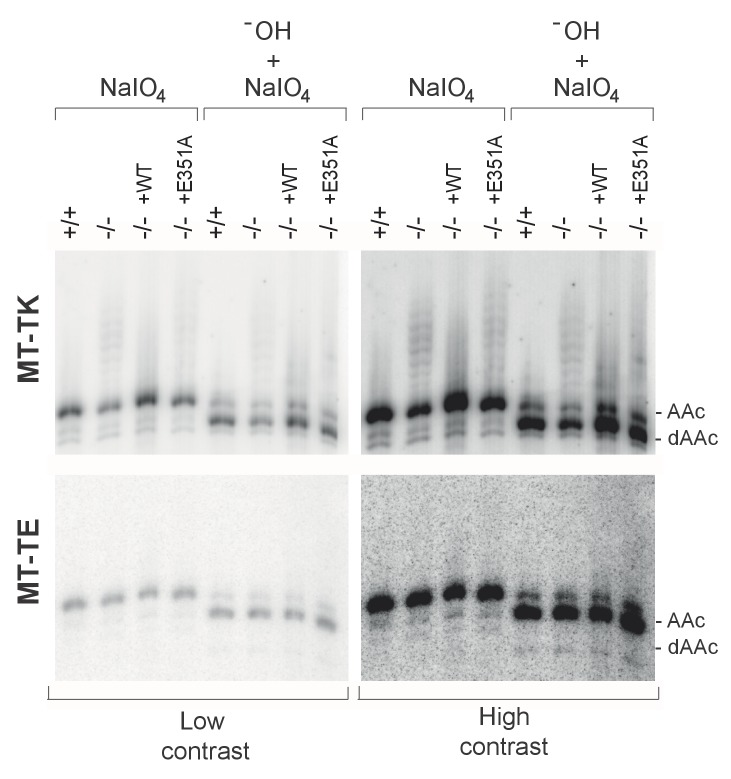
Figure 4—figure supplement 3. Aminoacylation analysis by sodium periodate oxidation.

Figure 4—figure supplement 3.

High-resolution northern blot analysis of total RNA extracted from PDE12+/+, PDE12−/−, PDE12−/− cell lines expressing PDE12 wild-type cDNA or E351A. Following extraction, RNA samples were either treated with NaIO4 followed by lysine, or intentionally deacylated (-OH) and then treated with NaIO4 followed by lysine. The blots were probed with the mt-tRNA-specific riboprobes as indicated. AAc indicates aminoacylated mt-tRNA, dAAc indicates deacylated mt-tRNA.