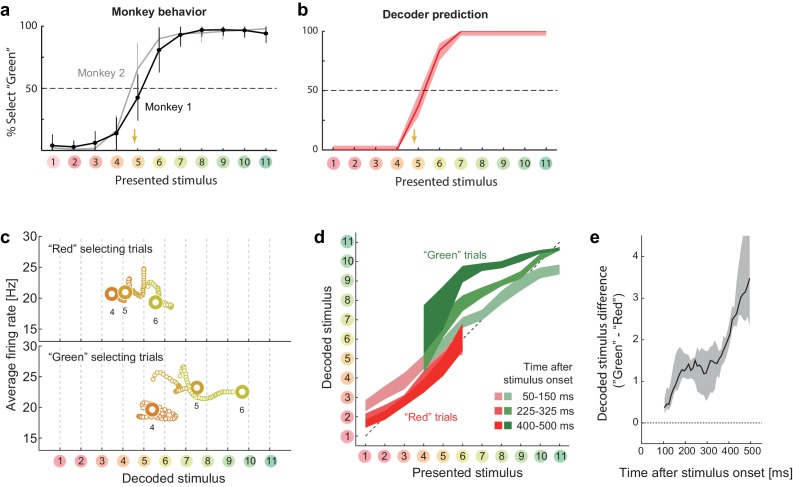
Figure 3. Choice-related dynamics.
(a) Actual monkey behavior. Note that the monkeys’ subjective category borders were consistent with the decoder output. The error bar is the standard error of mean. The yellow arrow on the horizontal axis indicates the sample color corresponding to the putative categorical boundary based on the behavior. (b) Fraction of selecting green category predicted by the likelihood-based decoding. The shaded area indicates the 25th–75th percentile on resampling. (c) The same analysis as Figure 2a (top) but with trial sets segregated based on whether the monkeys selected the ‘red’ or ‘green’ category. The results for stimuli #4–6 are shown. (d) The same analysis as Figure 2b, except that the trials were segregated based on the behavioral outcome. For stimuli #1–3 (#7–11), only the ‘Red’ (‘Green’) selecting trials were analyzed because the subjects rarely selected the other option for those stimuli. (e) Evolution of difference in the decoded color. Data were averaged across stimuli #4–6. The difference in the decoded stimulus was larger during the late period (450–550 ms) than the early period (50–150 ms) (p=0.002, permutation test).
DOI: http://dx.doi.org/10.7554/eLife.26868.008

