
Fig. 3.
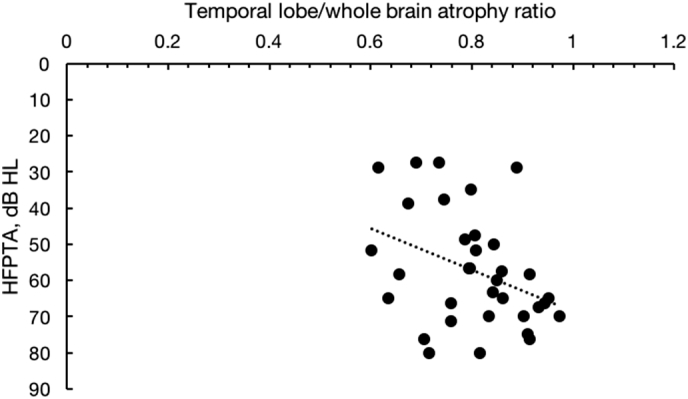
Correlation between temporal lobe atrophy to whole brain atrophy ratio and high frequency pure tone averages (HFPTA). Higher ratios represent a greater discordance in temporal lobe volume loss relative to whole brain loss. Higher HFPTAs represent worse hearing (r = 0.369, p = 0.032).