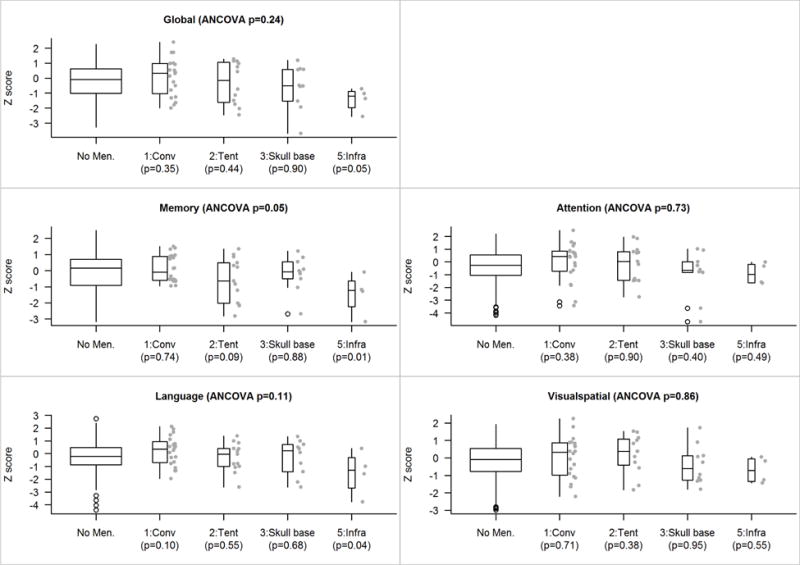
Figure 3.

Z score comparisons accounting for first/primary location. The p-value shown at the top of each panel is an based on a four-degree-of-freedom test of the five-level location variable (which includes a level for those with no meningioma) after adjusting for age, sex, education, and cycle number as covariates. Pairwise p-values versus those with no meningioma are shown along the bottom of each panel. Because there are few subjects in each location group we show their individual values beside the box plots.
