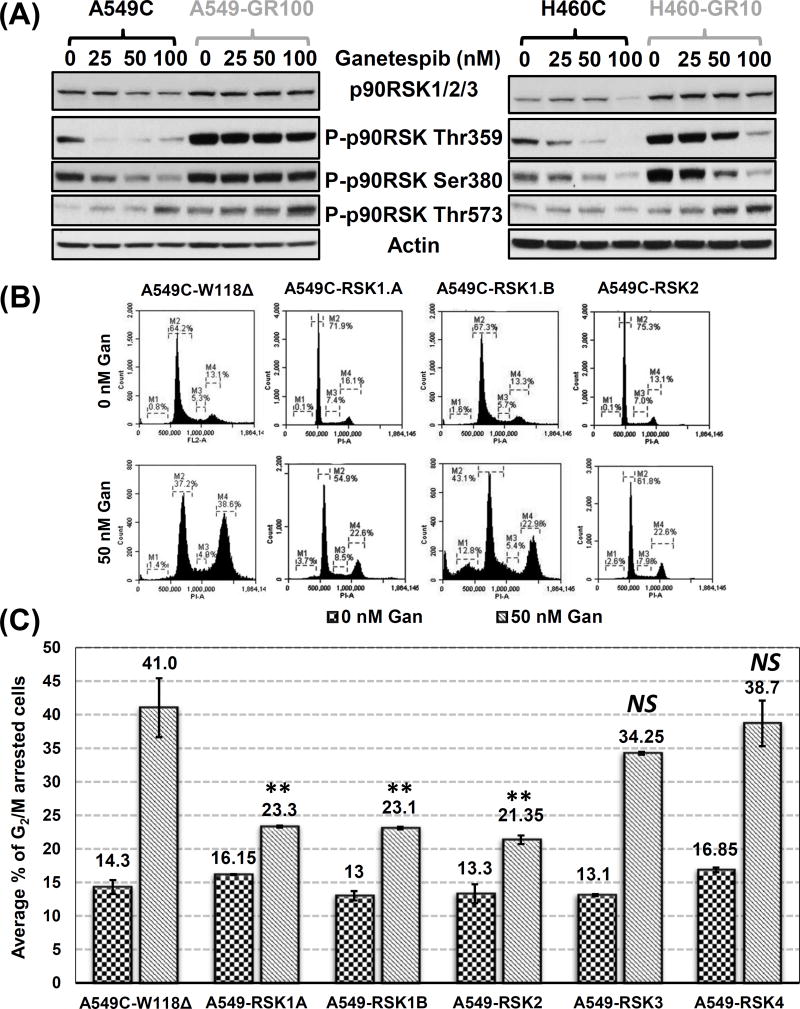
Figure 2. p90RSK activity is markedly upregulated in GR cells at baseline and after ganetespib treatment and overexpression of p90RSK leads to bypass of the ganetespib induced G2/M arrest.
(A) Western blot analysis of p90RSK activity after ganetespib treatment (48 hours) in A549 and H460, C vs. GR cells. (B) Representative cell cycle analysis at 48 hours after ganetespib (Gan) in parental A549C cells with individual p90RSK isoform overexpression. (C) Bar graph represents a comparative display of % of G2/M cells corresponding to (B). The average % of G2/M cells were compared between control cells expressing empty vector W118Δ and RSK1.A, RSK1.B, RSK2, RSK3 or RSK4 by performing unpaired t-test, and the level of significance were denoted as **, p < 0.01; NS = not significant.

