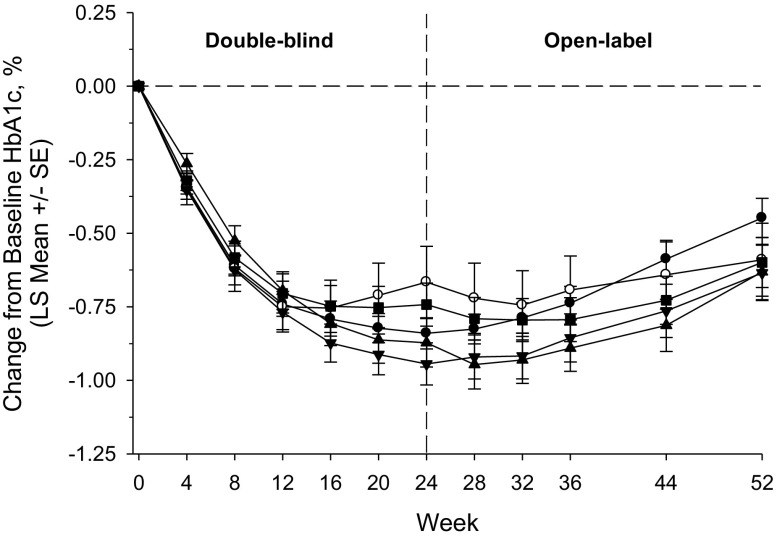
Fig. 3.
HbA1c change from baseline (%) through week 52 in the omarigliptin/omarigliptin treatment groups by background AHA; filled circle sulfonylurea; open circle glinide; filled inverted triangle biguanide; filled triangle thiazolidinedione; filled square α-glucosidase inhibitor; based on the longitudinal data analysis model described in the “Statistical Analyses” section

