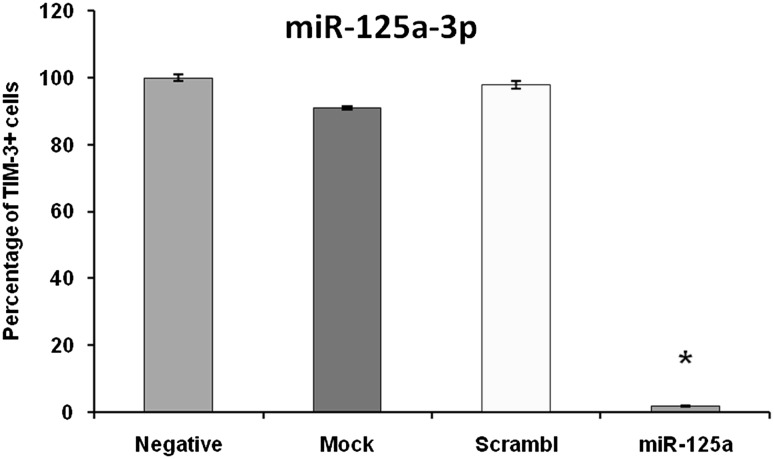
Fig. 3.
Flow cytometry analysis for TIM3 expression on HL-60 cells after transfection with miR-125a-3p mimic. Expression of TIM-3 on transfected cells was strongly inhibited in compare with negative control (P < 0.05). There was no meaningful difference between negative, mock and scrambled controls for TIM-3 expression. Data are shown as mean percentage ± relative SD of three identical repeats of each experiment. Asterisk (*) indicates statistical significance

