
Figure 4.
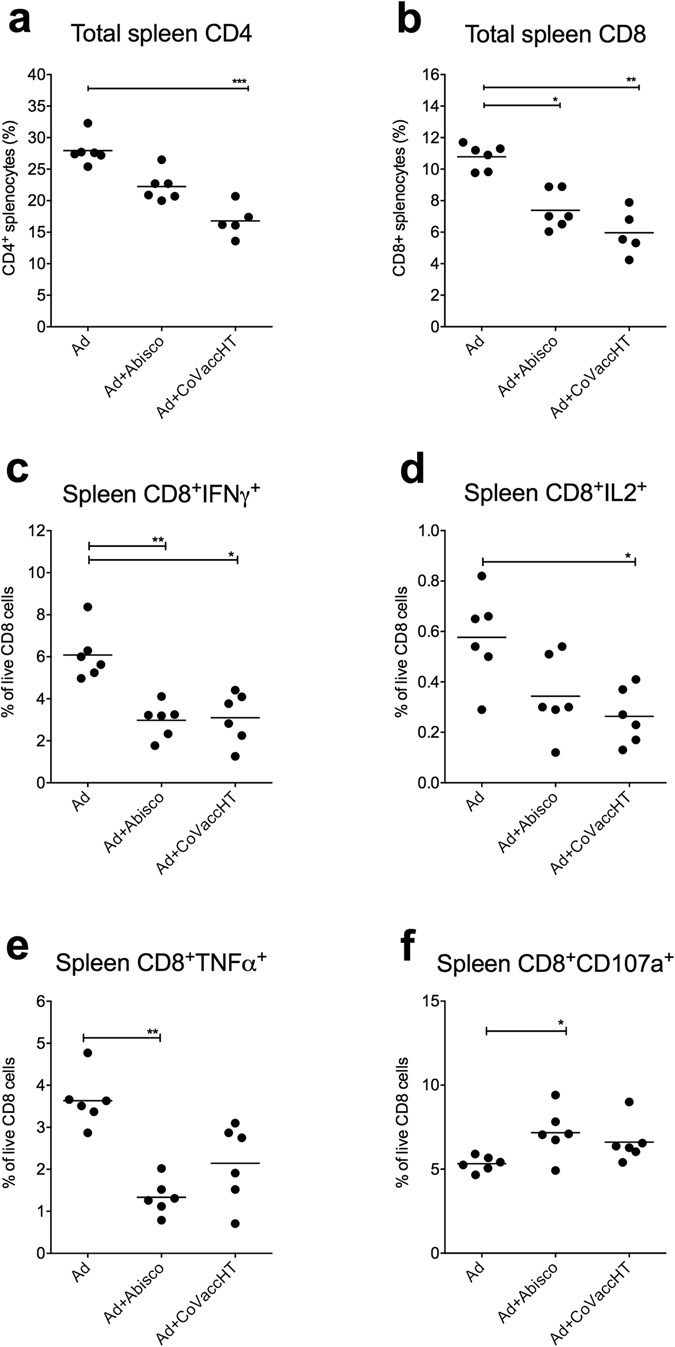
Splenocyte analysis in animals vaccinated with the adjuvanted and unadjuvanted Ad-ME.TRAP vaccine. Two weeks after immunisation of BALB/c mice (n = 6) with Ad-ME.TRAP (5 × 10⁹ vp/dose), alone or adjuvanted with Abisco®-100 or CoVaccineHT, relative proportion of different cell subsets in the spleen were analysed by flow cytometry. Data are shown for CD4 and CD8 T cells (panels a and b). In parallel, production of IFNγ, TNFα and IL2 and degranulation (CD107a expression) by CD8+ splenocytes, following 4 h of in vitro stimulation with Pb9 peptide, was assessed by intracellular staining and flow cytometry (c–f). Representative FACS dot plot data are shown in the Supplementary Figure S2b. Ranked one-way ANOVA analysis (Kruskal-Wallis) with Dunn’s test for multiple comparisons was used to assess statistical significance between groups; *p < 0.05, **p < 0.01, ***p < 0.001. Data shown are representative of three independent experiments.