
Figure 5.
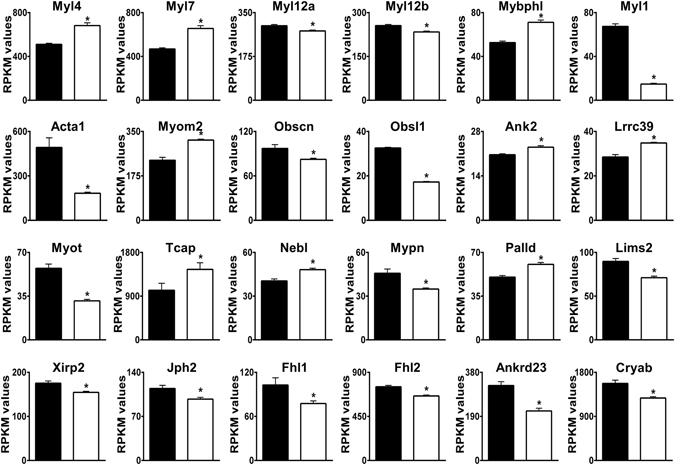
Differential expression of genes encoding sarcomere and sarcomeric cytoskeletal proteins. Genes relevant to these categories were identified by Gene Ontology analyses. RPKM values for WT (black bars) and AE3-null (white bars) hearts are shown. See Supplementary Information for detailed explanations and references for individual genes. The genes shown are a subset of 116 genes presented in Supplementary Table S7. Values are means ± SE; n = 4 for each genotype; *p ≤ 0.01 vs WT controls.