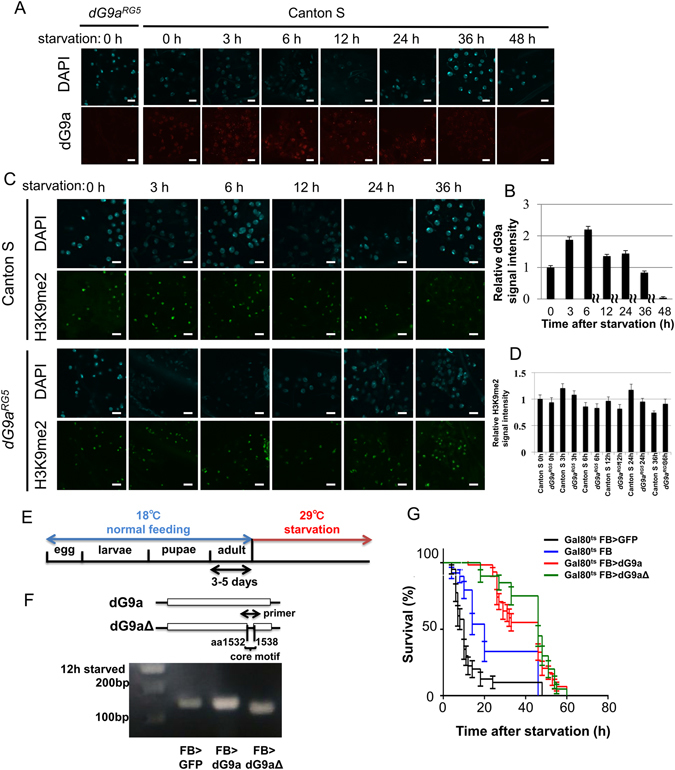
Figure 2.

dG9a function in the fat body is critical for adult fly viability under starvation stress. (A) Transient induction of dG9a in the adult fat body under starvation conditions. Fat bodies of the wild-type and dG9aRG5 mutant were immunostained with an anti-dG9a antibody (red) and stained with DAPI (cyan). The dG9aRG5 mutant was used as a negative control. (B) Quantification of dG9a signals in nuclei of the wild-type fat body. Values were adjusted by subtracting background fluorescence n = 10. (C) Quantification of H3K9me2 signals in nuclei of the wild-type and dG9aRG5 mutant fat bodies. Values were adjusted by subtracting background fluorescence (n = 10). (D) H3K9me2 signal in the adult fat body under starvation conditions. Fat bodies of the wild-type and dG9aRG5 mutant were immunostained with an anti-H3K9me2 antibody (green) and stained with DAPI (cyan). (E) The experimental design of dG9a overexpression under starvation conditions. (F) Confirmation of dG9a and dG9aΔ1532–1538 overexpression by semi-quantitative RT-PCR after 12 h of starvation. The primer included the core motif of the SET domain of dG9a. dG9a was more strongly expressed in FB > dG9a (FB-GAL4/GAL80ts.αTub84B; UAS-dG9a/+) than in FB > GFP (a control: FB-GAL4/GAL80ts.αTub84B; UAS-GFP/+). The amplicon size is 142 bp in FB > dG9a and FB > GFP. The amplicon size of FB > dG9aΔ(FB-GAL4/GAL80ts.αTub84B; UAS-dG9aΔ1532–1538/+) is 21 bp shorter because of the lack of the core motif of the SET domain. The full-length gel image is shown in Fig. S6A. (G) The results of a viability assay under starvation conditions using males of the control (GAL80ts FB > GFP: FB-GAL4/+; GAL80ts.αTub84B/UAS-GFP) (n = 40 from 2 independent experiments), another control (GAL80ts FB: FB-GAL4/+; GAL80ts.αTub84B/+) (n = 39 from 2 independent experiments), a dG9a overexpression line (GAL80ts FB > dG9a: FB-GAL4/+; GAL80ts.αTub84B/UAS-dG9a) (n = 58 from 3 independent experiments), and dG9aΔ1532–1538 overexpression line (GAL80ts FB > dG9aΔ: FB-GAL4/+; GAL80ts.αTub84B/UAS-dG9aΔ1532–1538) (n = 40 from 2 independent experiments). Significant differences were observed between GAL80ts FB > GFP and GAL80ts FB > dG9a (P < 0.0001) and between GAL80ts FB > GFP and GAL80ts FB > dG9aΔ (P < 0.0001). Significant differences were also noted between GAL80ts FB and GAL80ts FB > dG9a (P < 0.0001) and between GAL80ts FB and GAL80ts FB > dG9aΔ (P < 0.0001). No significant differences were found between GAL80ts FB > dG9a and GAL80ts FB > dG9aΔ (P = 0.23). (B,C,G) Error bars represent SE.
