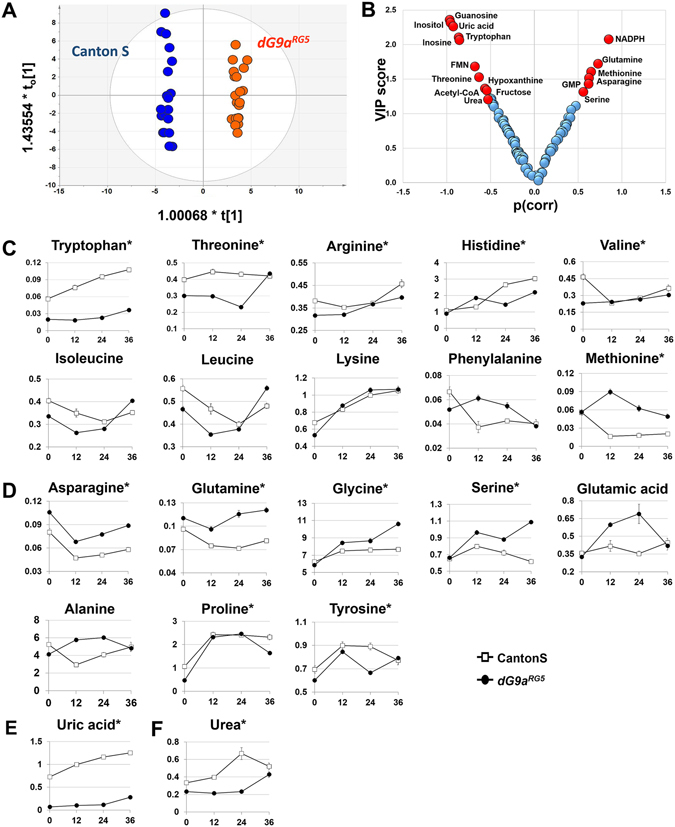
Figure 4.

Amino acid metabolism. A general view of the metabolites detected belonging to amino acids including: (A) The OPLS-DA score plot showed a clear separation between two genotypes with p(CV-ANOVA) = 1.99925E-23. (B) A plot formed by VIP scores and p(corr) revealed using OPLS-DA. The criteria VIP > 1.0 and |p(corr)|>0.5 were used to select potential metabolites (red) showing marked changes due to the loss of dG9a. (C) Essential amino acids (D) Non-essential amino acids (E) Uric acid (F) Urea. 4–5 replications for each time point. *The metabolites were significantly different in “genotype” between the wild-type and dG9aRG5 mutant in a two-way ANOVA with P < 0.05.
