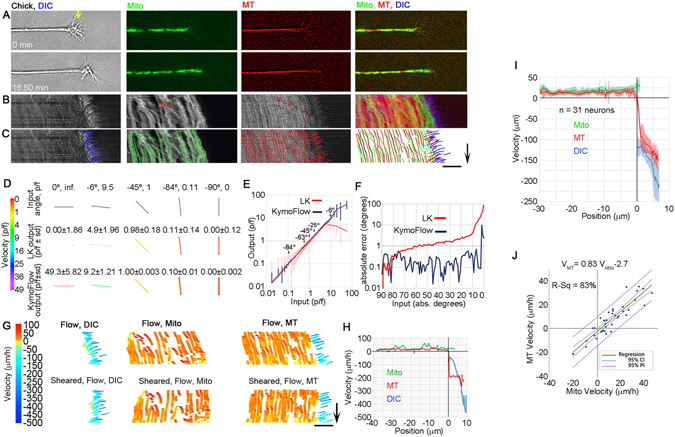
Figure 1.

Axonal MTs and docked mitochondria translocate anterogradely during axonal elongation. (A) Still images of a chick DRG growth cone at the beginning and end of a time-lapse sequence in DIC, mitochondrial, MT fluorescent channels, and merged channels. Yellow arrow marks the T zone. (B) Kymograph showing motion. Red arrows indicate a mitochondrion and MT speckle undergoing fast transport. Scale and time bar as indicated. (C) Traces used to measure motion; arrow 10 min and bar 10 μm. (D) Input and output of LKMTA and KymoFlow algorithms for a subset of angles with color coded local velocities. (E) Input versus output shown as the average ± sd of velocity in units of p/f. (F) Average absolute error in degrees as a function of input angle. (G) Raw and sheared KymoFlow maps with color-coded velocities; arrow 10 min and bar 10 μm. (H) Velocity as a function of distance for the shown example. Position 0 corresponds with the growth cone T zone, where retrograde flow transitions into anterograde motion. (I) Velocity ± 95% CI as a function of distance for 31 neurons. (J) Regression analysis of docked mitochondrial and axonal MT velocity for 31 neurons.
