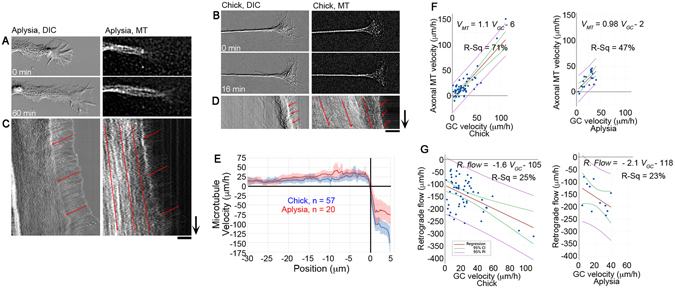
Figure 3.

The pattern of MT motion is conserved between chick and Aplysia. Still images at the beginning and end of time-lapse sequences in (A) Aplysia and (B) chick neurons. Kymographs of (C) Aplysia and (D) chick neurons with red arrows indicating anterograde motion of MTs in axons and retrograde flow of phase dense material in the growth cone P domain; arrows = 10 min, bars = 10 μm. (E) MT velocity as a function of distance from the T zone. (F) Regression analysis of axonal MT and growth cone velocity. (G) Regression analysis of growth cone and retrograde flow velocity.
