
Figure 5.
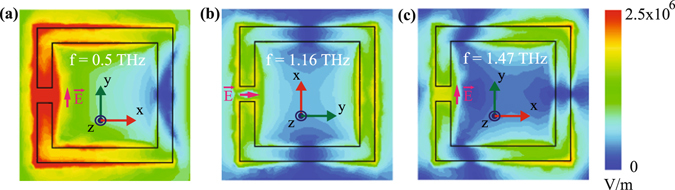
(a),(b) and (c) represent the Electric field profiles of 1st, 2nd and 3rd resonances at 0.5 THz, 1.16 THz and 1.47 THz, respectively. The green colored y-axis signifies the polarization direction of the incident electric filed.
Official websites use .gov
A
.gov website belongs to an official
government organization in the United States.
Secure .gov websites use HTTPS
A lock (
) or https:// means you've safely
connected to the .gov website. Share sensitive
information only on official, secure websites.
(a),(b) and (c) represent the Electric field profiles of 1st, 2nd and 3rd resonances at 0.5 THz, 1.16 THz and 1.47 THz, respectively. The green colored y-axis signifies the polarization direction of the incident electric filed.