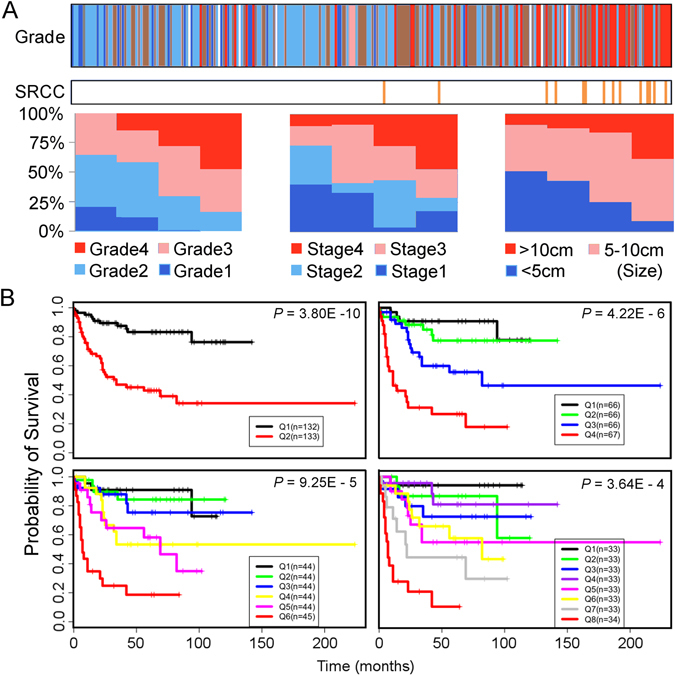
Figure 1.

Validation of continuous linear enhanced assessment of ccRCC (CLEAR) by correlation and survival analysis. (A) Validation of CLEAR approach by correlation analysis with clinical variables. 265 ccRCC samples are ranked in ascending order based on CLEAR score. The top panel color bar represents the grade distribution profile of 265 ccRCC samples, expressed as colored vertical bars (white bars represent absent data). An association between high grade tumors and high CLEAR scores is observed (Fisher’s exact, p = 7.594e-07). A similar association between sarcomatoid RCC (SRCC) and high CLEAR scores is observed in the second horizontal bar (Mann-Whitney U test, p = 1.38e-06). To depict association with other key clinical variables, samples were evenly separated into 4 subgroups along the ranking queue with bar charts showing proportional breakdown of clinical variables. Correlation of tumor stage, tumor size with CLEAR score were observed (Fisher’s exact, p = 5.892e-05; Mann-Whitney U test, p = 1.10e-05, respectively). (B) Kaplan-Meier curves of cancer-specific survival for 265 ccRCC samples. We evenly grouped 265 ccRCC samples along the CLEAR scale into two (Q1 and Q2 groups), four (Q1–Q4 groups), six (Q1–Q6 groups) and eight (Q1–Q8 groups). In addition to inspection, Kaplan-Meier analysis was used to evaluate the association of these subgroups with survival, demonstrating a significant correlation with cancer-specific survival at all subgroupings.
