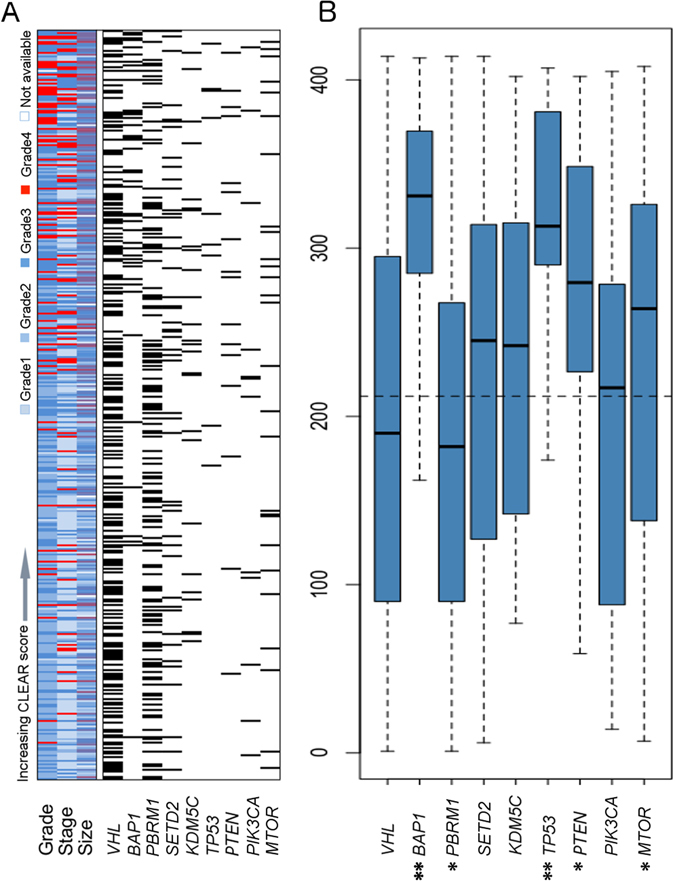
Figure 3.

Correlation of CLEAR score and mutation in TCGA cohort. (A) Individual correlation between tumor CLEAR score with tumor grade, stage and size distribution as well as mutation status are presented. The correlation of CLEAR score and TCGA grade, stage was investigated by ANOVA (p = 7.769e-09, p = 3.22e-08, respectively); the correlation of CLEAR score and TCGA sample size was estimated by spearman correlation (p = 4.252e-09). (B) Boxplots of CLEAR score distribution of samples with relevant gene mutations. The dashed line represents the median CLEAR score of the 414-sample set. Samples with mutated BAP1, TP53, PTEN and MTOR are associated with higher CLEAR scores (Mann–Whitney U test, *p ≤ 0.05, **p ≤ 0.001”).
