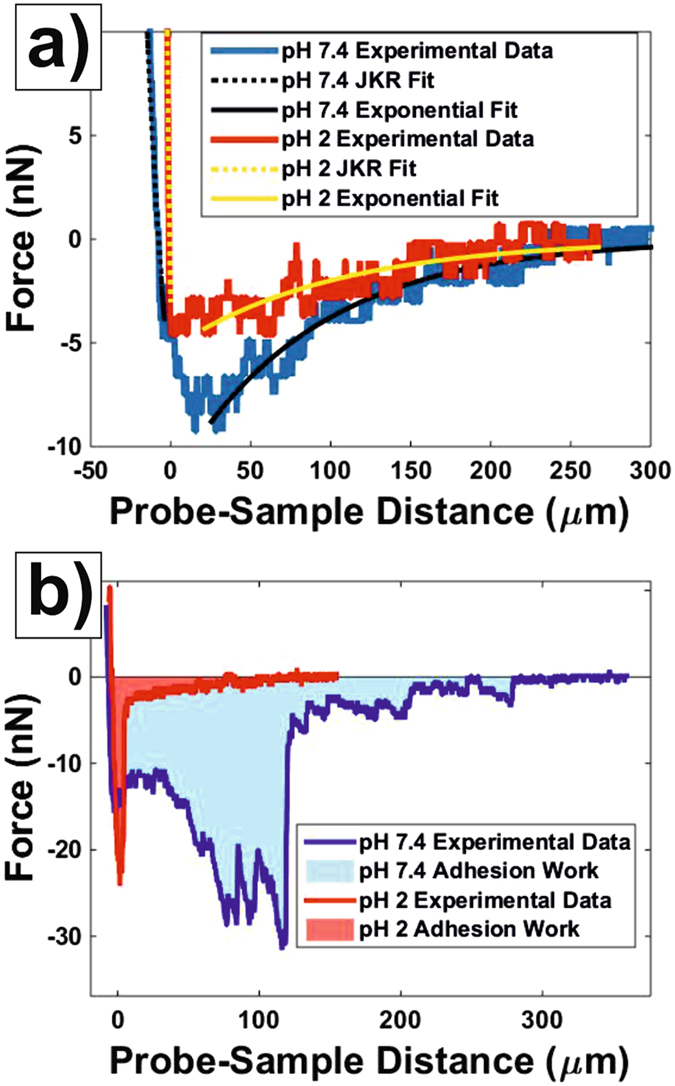
Figure 4.

Representative force measurements on ileum mucosa at different pH values. (a) Approach force measurements obtained in PBS pH 7.4 (blue) and pH 2 (red). Fits of the contact region to the JKR model (Eq. 3) and of the non-contact region to an exponential function (Eq. 8) are also shown. (b) Withdrawal force measurements obtained in PBS pH 7.4 (blue) and pH 2 (red). The shaded area below the adhesion peaks corresponds to the work of adhesion.
