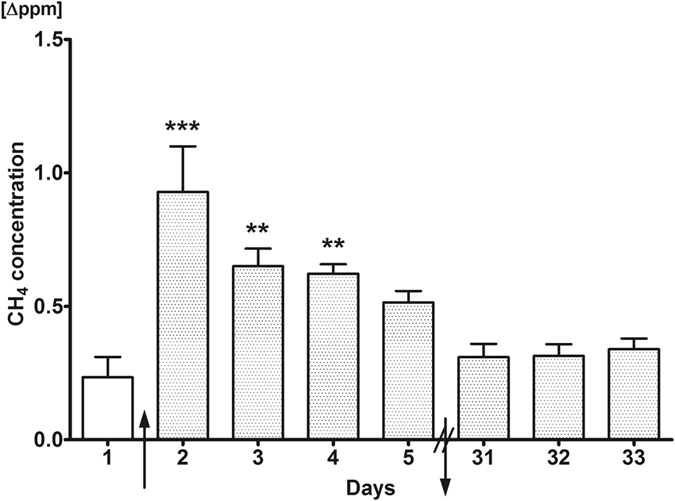
Figure 1.

Exhaled CH4 production profile of humans during the course of the study. Exhaled CH4 production on days 1–5 and 31–33 of the investigation is depicted. During the first measurement on day 1, all volunteers were untreated. Alcohol consumption induced significant CH4 production by the 2nd day compared to the 1st day, and this level decreased remarkably by the 5th day. Mean values and standard error of mean (SEM) are given; **p < 0.01 and ***p < 0.001 vs. day 1. The arrows pointing upwards and downwards represent start and end of alcohol intake, respectively. Statistics: one-way ANOVA with Dunnett’s multiple comparison test.
