Figure 4.

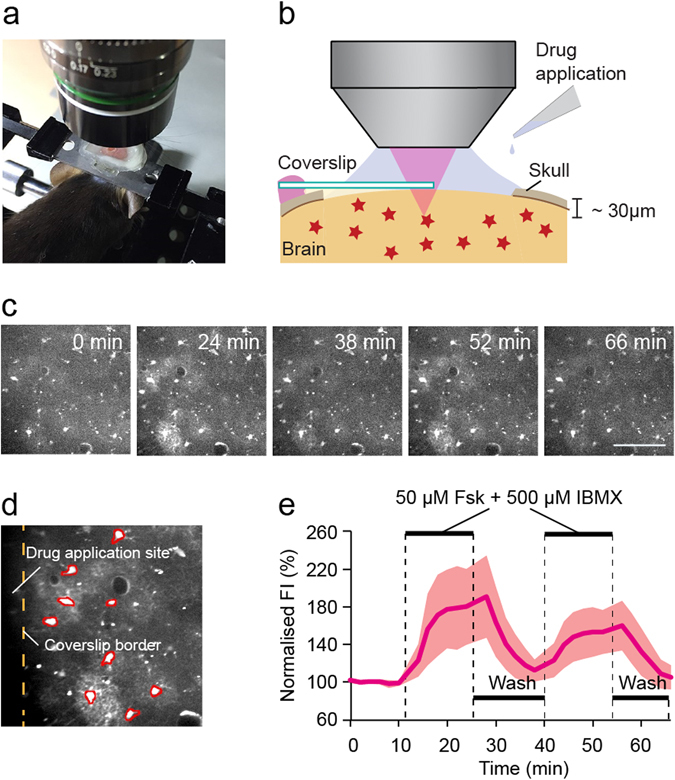
In vivo imaging of cerebral cortical astrocytes using Pink Flamindo. (a) Image showing the experimental setup of a mouse under anaesthesia, positioned under a two-photon microscope. (b) Schematic of the cranial window for in vivo two-photon imaging. (c) Sequential images of cortical astrocytes expressing Pink Flamindo during exposure to 50 μM Fsk and 500 μM IBMX. Scale bar represents 100 μm. (d) Enlarged image of c (24 min) to indicate the regions of interest. Analysed cells are marked in red. Yellow dashed line indicates the coverslip border (see b). Scale bar represents 50 μm. (e) Population mean trace of fluorescence intensity for Pink Flamindo from the images shown in c. The topical application of Fsk, IBMX and compound washout (indicated by black horizontal bars) was repeated twice. The data represent the means ± standard deviation (n = 9 cells).
