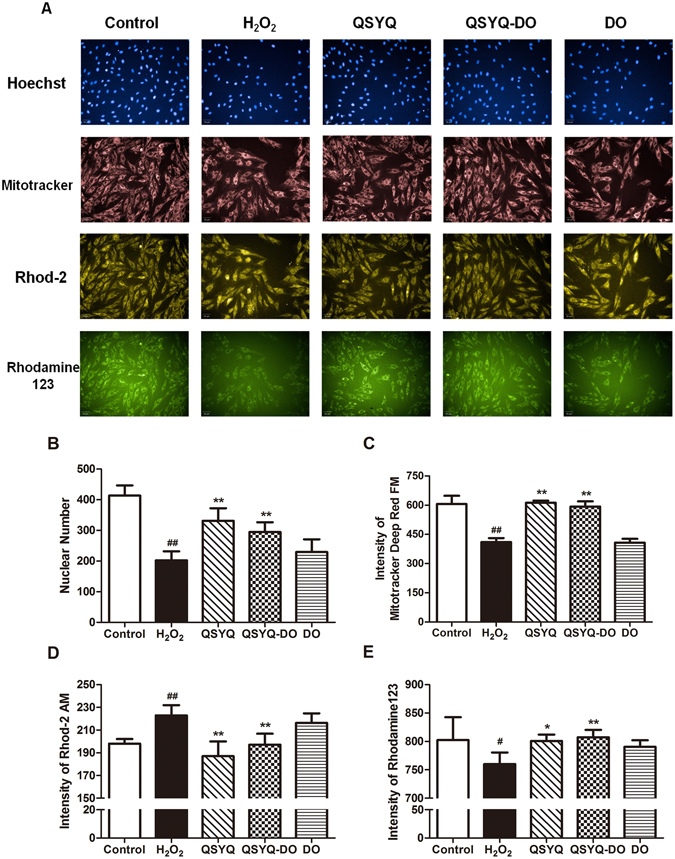
Figure 2.

Effects of QSYQ and QSYQ-DO on mitochondrial structure and function against H2O2 injury. H9c2 cardiomyocytes were treated with QSYQ, QSYQ-DO or DO volatile oils at a concentration of 0.2 mg/mL for 24 h and then exposed to 200 μM H2O2 for 2 h. (A) Representative images of mitochondrial structure and function were captured in Operetta High Content Imaging System. Fluorecent stains: Hoechst for nuclei and cell numbers (blue); Mitotracker for mitochondrial mass (red); Rhod-2 AM for cytosolic Ca2+ (yellow) and Rhodamine 123 for ΔΨm (green). (B–E) Quantitative analyses of fluorescence intensities in (A). Data are expressed as the mean ± SD, n = 3. #p < 0.05, ##p < 0.01 vs. Control group. *p < 0.05, **p < 0.01 vs. H2O2 group.
