
Figure 6.
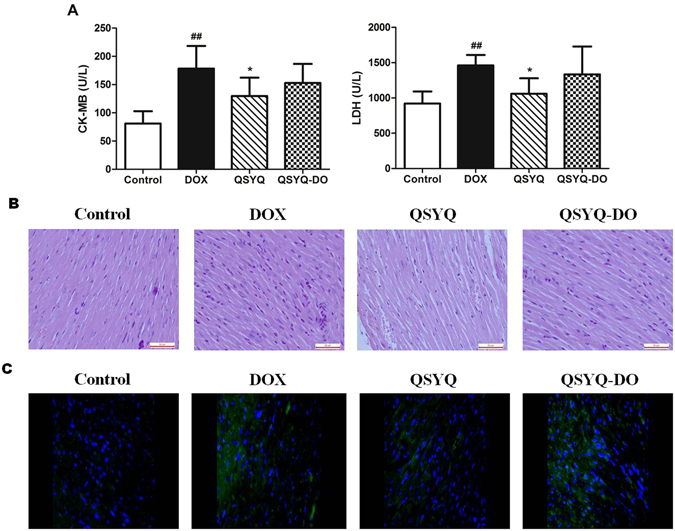
Effects of QSYQ and QSYQ-DO on cardiac enzyme release and myocardial histology. (A) CK-MB and LDH release in serum of DOX-treated mice, (B) Representative images showing H&E staining of heart sections (400 × magnification), and (C) Representative photomicrographs of TUNEL staining images. Total nuclei were labeled with DAPI (blue) and apoptotic nuclei were detected by TUNEL staining (green). One of 8 similar images was shown. All scale bars are 50 μm. Data are expressed as mean ± SD, n = 8. ##p < 0.01 vs. Control group. *p < 0.05 vs. DOX group.