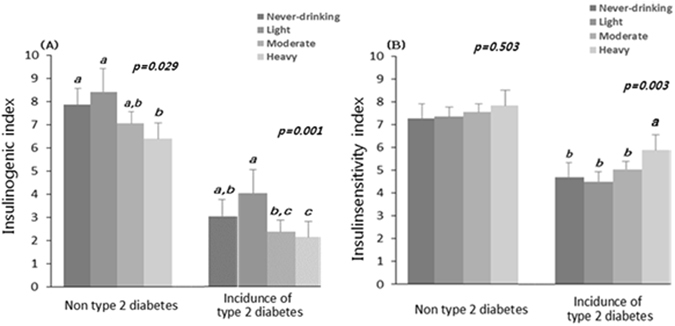
Figure 2.

The associations between alcohol consumption pattern and (A) insulin secretion capacity (IGI60) and (B) insulin sensitivity (ISI) at the end point of follow-up. A, and B is shown as the geometric mean and Error bars represent 95% CIs. P-values were determined using one-way anova and post-hoc (Duncan) for continuous variables according to alcohol consumption pattern at baseline and over 10-years. Different letters, a,b,c,d, indicate significant difference of means among four groups by Duncan test.
