
Figure 3.
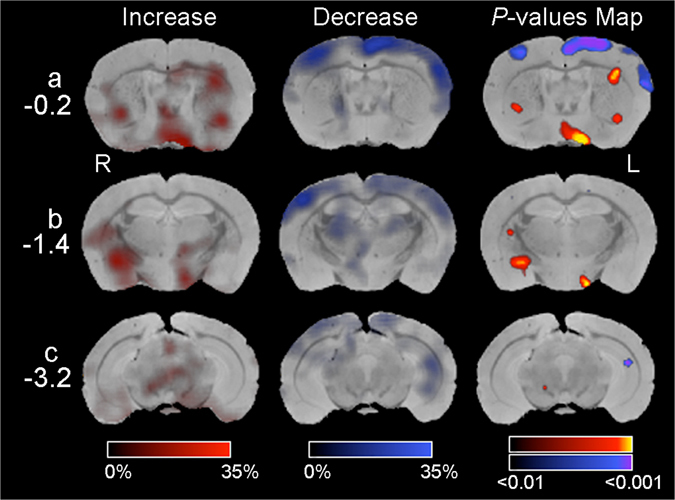
Changes of regional cerebral blood flow (rCBF) in Nptn loxloxEmx1Cre brain. Compared to control Nptn lox/lox mice, brain areas with increased rCBF in Nptn loxloxEmx1Cre mice are indicated in red (Increase, left column) and with decreased rCBF in blue (Decrease, middle column). rCBF in mutant mice was scored as % of change relative to control mice. P-values Map (right column) scores changes in rCBF according to their statistical significance level in the color-ranged bars from P < 0.01 to P < 0.001. R, right brain hemisphere. L, left. Distances from bregma are indicated (−0.2, −1.4, and −3.2).