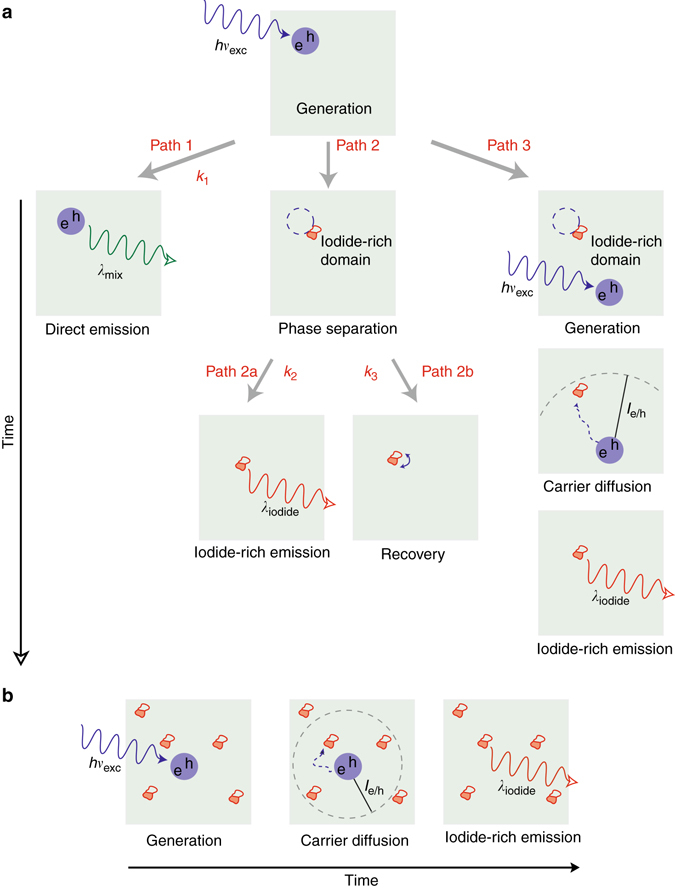
Fig. 2.

Schematic of relevant kinetic processes during halide phase segregation. a low and b high excitation intensity light-induced phase separation of MAPb(I1−xBrx)3 (MA = CH3NH3 +). Microscopic rate constants (k 1−3) associated with the underlying kinetic model have been provided. Dark circles denote photogenerated electron–hole pairs. Empty circles denote electron–hole pairs which have induced phase separation. Filled red and white regions represent phase separated iodide-rich and corresponding bromide-rich domains
