
Figure 3.
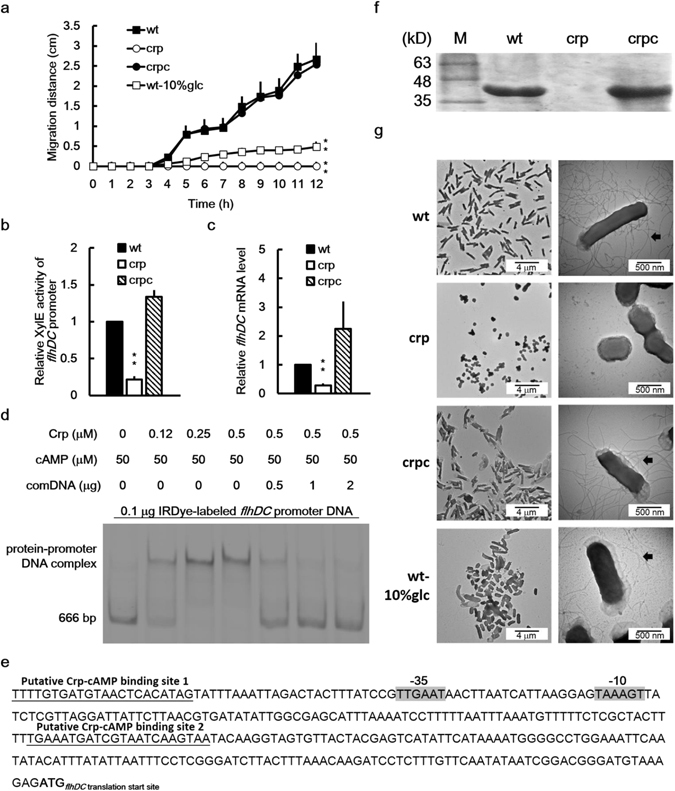
Loss of crp or high glucose reduced swarming, production of flagellin/flagella and flhDC expression in P. mirabilis. (a) Swarming migration of the wild-type in the absence or presence of 10% glucose, crp mutant and the crp-complemented strain. An aliquot (5 μl) of overnight cultures was inoculated centrally onto the swarming plate. The migration distance was measured hourly after inoculation. The significant difference from wild-type is indicated with an asterisk at 12 h. (b) Promoter activities of flhDC in wild-type, crp mutant, and crp-complemented strain. The activities of XylE in the flhDC-xylE reporter plasmid-transformed bacterial strains were determined using the reporter assay at 7 h after incubation. The value obtained for the wild-type was set at 1. (c) The flhDC mRNA levels in the wild-type, crp mutant, and crp-complemented strain. The flhDC mRNA amounts were quantified using real-time RT-PCR at 7 h after incubation. The value obtained for the wild-type was set at 1. In (a),(b) or (c), the data represent the averages and standard deviations of three independent experiments. Significant difference from the wild-type is indicated with an asterisk (**P < 0.01 by Student’s t test). (d) The binding of P. mirabilis Crp-cAMP to the flhDC promoter region revealed using an EMSA. IRDye-labeled DNA fragments (0.1 μg) of the flhDC promoter region (666 bp) obtained by PCR were incubated with the purified His-tagged Crp (0–0.5 μM) in the presence of cAMP. The protein-DNA complex was resolved on a 5% non-denaturing polyacrylamide gel and the gel image was obtained by the quantitative infrared fluorescent imaging system. The unlabeled flhDC promoter DNA acted as a competitor to verify the binding specificity. comDNA, competitive DNA fragments. (e) A diagram showing the Crp-cAMP binding sites upstream of flhDC gene. The putative Crp-cAMP binding sequences are underlined and the putative −10 and −35 promoter sequences of sigma 70 are shadowed. (f) The flagellin levels of wild-type, crp mutant and crp-complemented strain. Flagellin levels were examined after seeding on the swarming plates for 4 h by the SDS-PAGE. The band of flagellin is 40 kD. M, molecular weight marker. (g) TEM pictures of wild-type in the absence or presence of 10% glucose, crp mutant and the crp-complemented strain. Bacterial cultures were applied onto a carbon-coated grid, cells were stained with 1% PTA and TEM pictures were taken. Flagella are indicated by arrows. In (a–c,f and g), wt, wild-type; wt-10%glc, wild-type with 10% glucose; crp, crp mutant; crpc, crp-complemented strain. Full-length gels for (d) and (f) are shown in Supplementary Fig. S8.