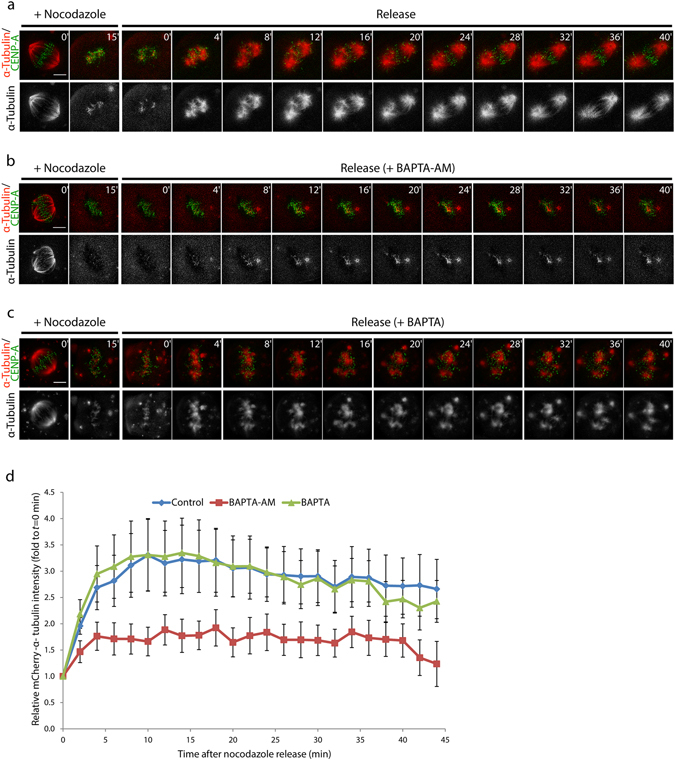
Figure 2.

BAPTA-AM treatment inhibits microtubule re-polymerisation. (a–c) Time-lapse images of U2OS cells expressing CENP-A-GFP and mCherry-α-tubulin during microtubule de-/re-polymerisation assay. Cells were released from nocodazole into fresh medium containing drugs as indicated. (d) A graph presenting the relative mCherry-α-tubulin at kinetochore of each treatment. Error bars indicate standard errors (n = 15 cells for control, n = 12 cells for BAPTA-AM, and n = 8 cells for BAPTA). Bar, 5 µm.
