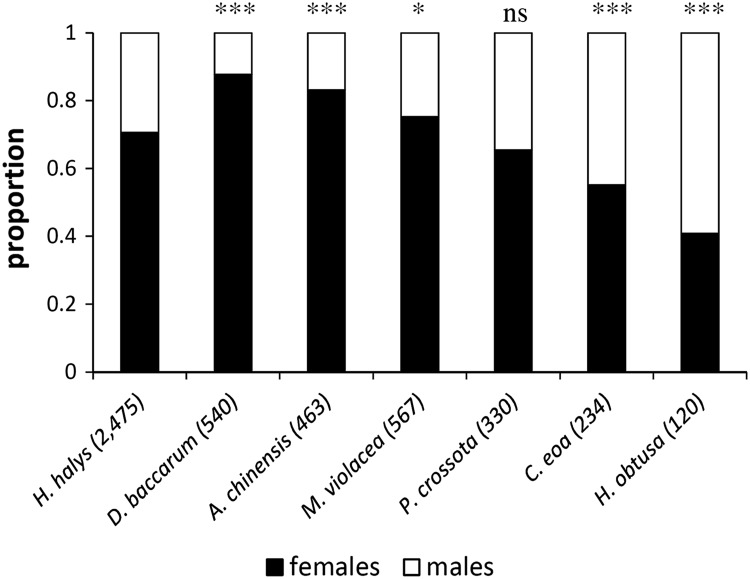
Fig. 3.
Sex ratio of offspring reared from H. halys and six non-target hosts (in brackets: no. of individuals emerged); bars marked with asterisks indicate a significant difference between control (H. halys) and treatments (non-target species) groups (Pearson Chi-Square test: p < 0.05; **p < 0.01; ***p < 0.001; ns not significantly different)

