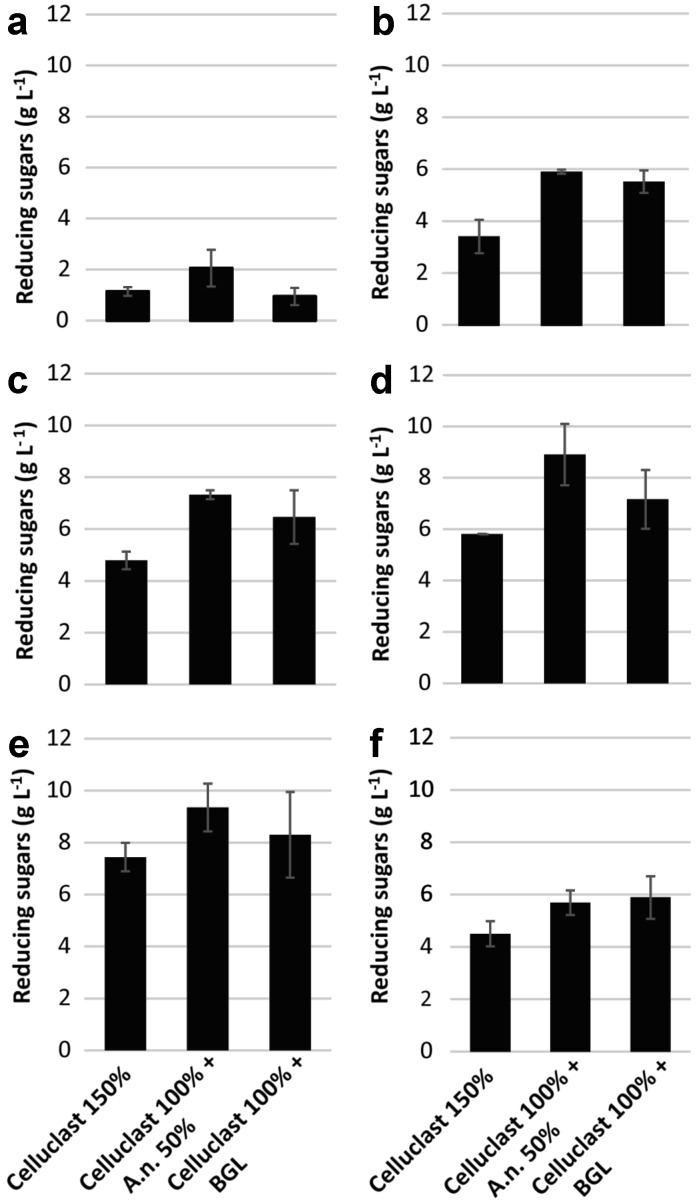
Fig. 2.
Concentrations of reducing sugars measured by the DNS assay after 24 h hydrolysis at 50 °C of: a wheat bran, b Avicel, c Fibers 1(ND), d Fibers 2(ND), e Fibers 3(ND) and f Fibers 2(D). Loading of the substrates, Celluclast and A. niger (A.n.) supernatant were the same as described in Fig. 1. Loading of pure β-glucosidase (BGL) was 0.22 U ml−1. Mean values and standard deviations of four replicates are presented

