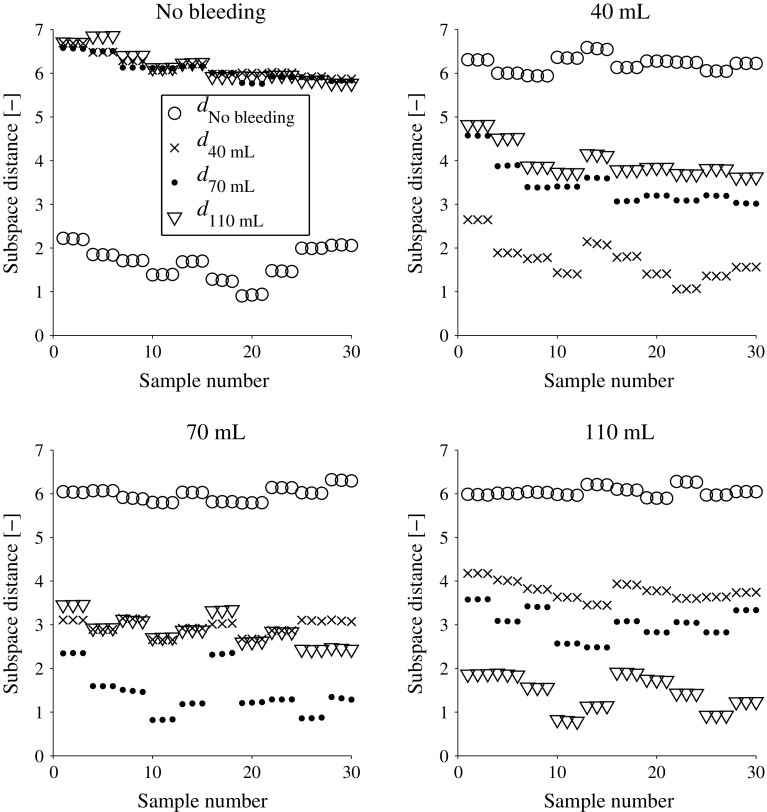
Fig. 5.
Distances to each subspace for all observations for the laboratory data. The class c is given in the plot titles. We see that the classification accuracy is 100 % since all observations have shortest subspace distance to their respective class (1). We also see that there is a tendency that bleedings of sizes close to each other are more similar than bleeding sizes far apart, as measured by the subspace distances, e.g., for the test on 110 mL is (bottom right plot). The variability caused by taking the helmet on and off every third measurement shows in the plots; groups with repeated observations are close to each other, whereas there can be a relatively large difference between groups

