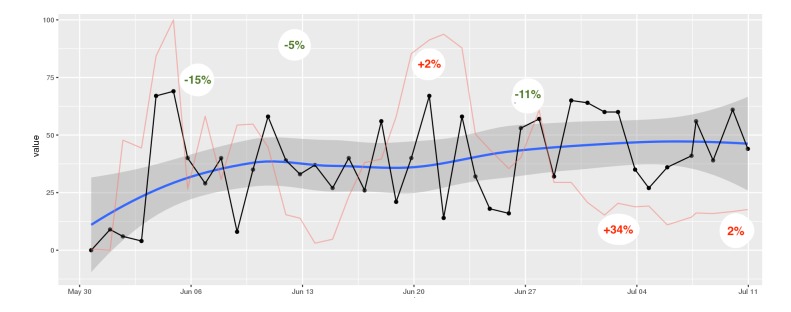
Figure 5.
Time series plot showing mean scores of the “Problem Solving” scale of the short intersession questionnaire. A line smoothed by local regression scatterplot smoothing (LOESS), including the 95% CI is added for easy interpretation of long-term change. The red line represents the measure of dynamic complexity that was rescaled from 0 (minimum complexity) to 100 (maximum complexity). Percentage values indicate weekly treatment outcome in percent symptom change.

