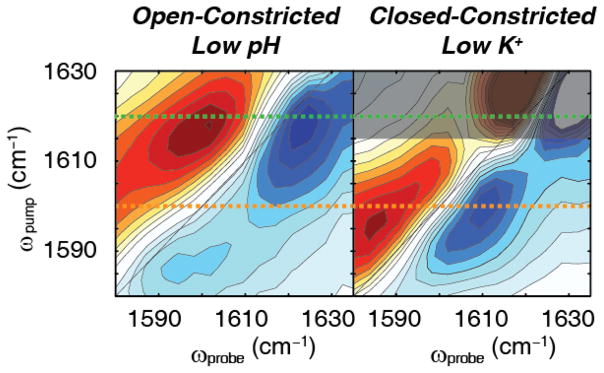
Fig. 2. 2D IR difference spectra of KcsA in low pH and low KCl conditions.
(A) Difference spectrum of KcsA in 150 mM KCl, pH 4 buffer. In this buffer condition, the intracellular gate opens, but the selectivity filter is constricted, creating the open-constricted state. We use the maximum of the 0→1 transition to mark the absorption frequency. The difference spectrum shows a set a pair of high frequency peaks with the (blue) fundamental peak at (ωpump, ωprobe) = (1618 cm−1, 1624 cm−1). (B) Difference spectrum of KcsA in 1 mM KCl, pH 7 buffer. At pH 7, the intracellular gate remains closed. At low potassium concentration the selectivity filter collapses. Thus, these conditions create the closed-constricted state. In this spectrum, we observe a single pair of peaks with the (blue) fundamental peak at the peak maximum of (ωpump, ωprobe) = (1599 cm−1, 1609 cm−1). The darkened region indicates background signals that could not be reliably subtracted. Dashed lines at ωpump = 1620 cm−1 (green) and ωpump = 1600 cm−1 (orange) are shown as guides.

