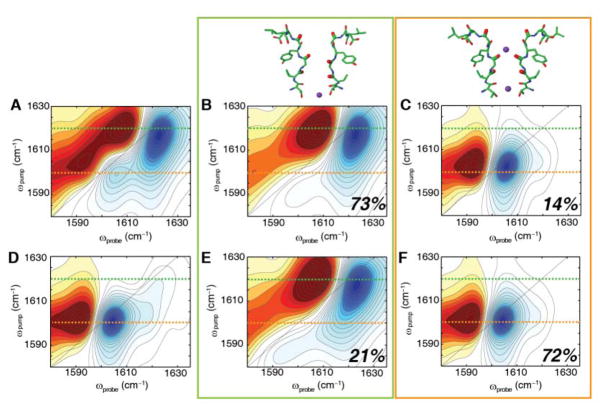
Fig. 3. Two major conformations of KcsA selectivity filter from 2D IR simulations for the (top) open-constricted state and (bottom) closed-constricted state.
(A) Calculated 2D IR spectrum of the entire MD trajectory of the open-constricted state reveals a major peak at ωpump = 1617 cm−1 and a minor peak at ωpump = 1602 cm−1. Similar to the closed-constricted state analysis (top), two major ion binding configurations are revealed. (B) Spectrum for structural confomation with no K+ ion at the S1 binding site, exhibiting a high frequency peak at ωpump = 1617 cm−1 and constituting 73% of the states observed in the MD trajectory of the open-constricted state. (C) Spectrum for states in which the S1 site is occupied, which accounts for 14% of all the structures in the MD trajectory. The calculated spectrum of this conformation reveals a single low frequency peak at ωpump = 1602 cm−1. (D) Calculated 2D IR spectrum of the entire MD trajectory of the closed-constricted state reveals a major peak at ωpump = 1601 cm−1. (E) Simulated spectrum of the structural configuration without a K+ ion in S1 shows a high frequency peak at ωpump = 1617 cm−1. This configuration in 21% of the structural snapshots. (F) The simulated spectrum for the structural sub-ensemble with a K+ ion bound at S1, which accounts for 72% of the structural snapshots in the MD trajectory. The major peak has a peak frequency of ωpump = 1601 cm−1. Dashed lines at ωpump = 1620 cm−1 (green) and ωpump = 1600 cm−1 (orange) are shown as guides. All spectra are normalized to the most intense peak.

