

Abstract
Provider consolidation has intensified concerns that providers with market power may be able to charge higher prices without having to deliver better care. Providers have argued that higher prices cover the costs of delivering higher-quality care. We examined the relationship between physician practice prices for outpatient services and the quality and efficiency of care provided to their patients. Using commercial claims, we classified practices as high-priced or low-priced. We compared care quality, utilization, and spending between high-priced and low-priced practices in the same areas using data from the Consumer Assessment of Health Care Providers and Systems survey and linked claims for Medicare beneficiaries. Compared with low-priced practices, high-priced practices were much larger and received 36% higher prices. Patients of high-priced practices reported significantly higher scores on some measures of care coordination and management, but did not differ meaningfully in their overall care ratings, other domains of patient experiences (including physician ratings and access to care), receipt of mammography, vaccinations, or diabetes services, acute care use, or total Medicare spending. These findings suggest an overall weak relationship between practices’ prices and the quality and efficiency of care they provide, calling into question claims that high-priced providers deliver substantially higher-value care.
The wide variation in health care prices in the United States has raised concerns about whether high prices correspond to better care.1–3 These concerns have intensified as providers consolidate into larger organizations, enhancing their bargaining power with insurers and contributing to rising prices.1,3–6 Providers with market power facing limited competition may be able to charge substantially higher prices without having to deliver better care, particularly because health insurance largely shields patients from their costs of care and because patients may not be able to discern good from bad quality.3,7,8 Providers, however, have argued that higher prices cover the costs of providing higher quality care and reflect patients’ willingness to pay for better care.9,10
Due to the limited availability of data linking providers’ prices to measures of their quality of care, few studies have directly examined whether higher provider prices are associated with better care.11 To date, most research has focused on the relationship between utilization and quality in the fee-for-service Medicare program, in which prices are set administratively.11 A smaller body of research, focusing on hospitals, has found higher prices to be weakly associated with performance on quality measures.1,12
Other studies have examined the relationship between market structure or organizational structure (key determinants of prices) and quality of care. Consolidation in U.S. hospital markets has generally been associated with worse quality, suggesting that less competition may blunt hospitals’ incentives to improve quality.3,8 Studies of physician group size and outpatient quality of care have produced mixed findings. Larger groups have been found to perform better on some process measures of care but worse on rates of preventable hospitalizations and do not have lower rates of readmissions.13–15 Similarly, acquisition of physician groups by hospitals or health systems has been associated with no change or only modest improvements in quality.14,16 To our knowledge, no prior study has assessed the relationship between outpatient prices and quality.
In this study, we examined the association between physician practices’ commercial prices for office visits and the quality and use of care among fee-for-service Medicare patients served by the practices. To conduct these analyses, practice-level price data from FAIR Health were linked to a broad set of quality and utilization measures for Medicare patients, including assessments of patients’ experiences with care from the Consumer Assessment of Health Care Providers and Systems (CAHPS) survey.17
We categorized practices according to their commercial rates but compared their performance on quality measures in Medicare — in which benefit design is relatively uniform and administered prices vary little within markets — so that our assessments of quality would not be affected by patients sorting to differently priced providers based on their ability to pay for care. Thus, the main objective of our study was to assess whether practices that differ in the prices they negotiate with commercial insurers also differ in determinants of care that affect quality or utilization systemically for their patients.
STUDY DATA AND METHODS
Data Sources and Practice Definition
To assess quality and use of care, we analyzed data from the 2013 fee-for-service Medicare CAHPS survey and linked Medicare claims from 2011–2012 for survey respondents. Because the CAHPS survey is administered early in the year and asks patients to rate their experiences with care over the prior six months, we used 2012 claims to attribute each respondent to the provider taxpayer identification number (TIN) that accounted for more of the respondent’s office visits with a primary care physician than any other TIN, consistent with prior work (Appendix18).17,19 We used data from FAIR Health, a national multi-payer database of commercial claims, to determine the prices of office visits received by each TIN.20
We refer to TINs as practices, recognizing that a TIN can vary in the level of provider organization that it represents. A TIN may represent a solo practitioner, a physician group, or a large provider organization, such as an integrated delivery system. Large organizations often bill under multiple TINs but negotiate prices with insurers as a single entity.
In our main analysis, we examined the relationship between practice (TIN-level) prices and quality, rather than the relationship between organizational size and quality, in part because we were unable to identify large organizations composed of multiple TINs in claims data. Moreover, practice prices reflect determinants of market power of the negotiating provider organization other than size (e.g., reputation), and our primary objective was to determine if providers obtaining higher prices delivered higher quality or more efficient care. Nevertheless, to inform expectations of changes in care from provider consolidation, we also examined the association between practice size and performance on measures of quality and efficiency in a secondary analysis.
Study Design and Sample
We compared practices within the same area to hold constant market-level factors that affect health care prices, quality, or utilization and to control for between-area differences in patient characteristics. We conducted cross-sectional comparisons of patients’ experiences with care, use of preventive services, use of acute care, and Medicare spending, between CAHPS respondents in the same primary care service area (PCSA) who were attributed to practices with above vs. below average prices. PCSAs are geographically contiguous collections of ZIP codes, developed by Dartmouth Atlas researchers, that capture a majority of Medicare residents’ primary care use.21
Our analysis included CAHPS respondents who were continuously enrolled in fee-for-service Medicare (Parts A and B) in 2011 and 2012, who had at least one office visit with a primary care physician in 2012 to allow attribution to a practice, and who were attributed to a practice with commercial claims for office visits. To minimize potential bias from unobserved differences in patients’ ability or willingness to travel long distances for care, we excluded patients attributed to practices outside of the PCSA in which they resided (Appendix).18 Finally, we limited our analysis to PCSAs with patients attributed to at least two differently priced practices.
Study Variables
Measures of Quality of Care, Utilization, and Spending
We used 18 CAHPS survey items to examine 4 domains of patient experiences (Appendix18). Following previously described methods,17 we aggregated closely related items to form composite scores for 2 of these domains, giving equal weight to each item for which a patient provided a valid response when calculating the patient’s composite score (Appendix18).
From linked Medicare claims for CAHPS respondents, we constructed 3 process measures of diabetes care based on Healthcare Effectiveness Data and Information Set (HEDIS) quality measures. For women ages 65–69, we assessed receipt of a mammogram in 2011 or 2012. For patients with a diagnosis of diabetes recorded in the Chronic Condition Data Warehouse (CCW) by the start of 2012, we assessed receipt of a diabetic retinal examination in 2011 or 2012, glycated hemoglobin testing in 2012, and low-density lipoprotein testing in 2012. As two additional process measures of quality, we used CAHPS survey data to assess influenza vaccination in the past year among all respondents and pneumococcal vaccination among respondents age 65 or older. Finally, we used 2012 claims to assess each respondent’s total Part A and B Medicare spending, number of emergency department visits, number of hospitalizations, and number of hospitalizations for ambulatory care sensitive conditions (ACSCs) during the year.22 Because Medicare prices are administered and do not vary within geographic areas for the same service in the same setting, differences in total Medicare spending between patients of office-based practices should largely reflect differences in utilization only.
Provider Prices
We measured prices in FAIR Health using the allowed amount for claims, which is the sum of the negotiated insurer payment and patient out-of-pocket costs. To control for insurer market presence, we compared prices between practices located in the same PCSA and, for each PCSA, used the largest insurer’s claims to assess prices.
We used 2014 claims to measure prices because prices in 2014 were likely negotiated in the preceding year or two, when we assessed practice quality and efficiency, and our main objective was to determine if higher prices reflected a track record of higher quality or greater efficiency. For each practice, we used outpatient professional claims billed by physicians in the office setting (place of service code 11) to determine the average price for the most commonly occurring professional service: Current Procedural Terminology (CPT) code 99213, which is an office visit for a medium-complexity patient (Appendix).18 Prior research suggests that prices for office visits are strongly correlated with the prices of other medical services.23,24 We included prices for office visits with either primary care physicians or specialists because prices were similar for primary care and specialist physicians within the same practice (Appendix).18
To ensure that we compared fee-for-service prices across practices for the same services, we excluded claims with procedure modifier codes, claims for office visits with non-physicians, claims for individuals who were not in preferred provider organization or point of service health plans, out-of-network claims, and claims with implausibly low (including $0 prices that likely reflected capitated arrangements) or high (>99th percentile) prices (Appendix18).25 After applying these exclusions, the prices of 84% of claims in our analysis equaled the modal price for the billing practice. This suggests a high level of reliability in our measurement of practice prices. We categorized practices as high-priced or low-priced based on whether its mean price was above or below, respectively, the mean for all practices in the same PCSA.
Patient Characteristics
From 2012 Medicare enrollment data, we determined age, sex, race and ethnicity, whether disability was the original reason for Medicare eligibility, receipt of Medicaid benefits, and the presence of end-stage renal disease. From the CCW, which describes Medicare beneficiaries’ accumulated burden of chronic disease since 1999, we assessed the presence of 27 chronic conditions by the start of 2012. From diagnoses in 2011 claims, we also calculated each respondent’s Hierarchical Condition Category (HCC) risk score. Finally, we used CAHPS survey data to assess respondents’ educational attainment, sources of supplemental and prescription drug coverage, smoking status, self-reported general and mental health status, difficulties with activities of daily living, whether the respondent lived alone, and whether the respondent required a helper to complete the survey, which has been found to be related to cognitive impairment.26
Statistical Analyses
To compare performance on measures of quality, utilization, and spending between patients of high-priced vs. low-priced practices, we estimated a patient-level linear regression model of each measure as a function of whether the patient was attributed to a high-priced or low-priced practice, PCSA fixed effects, and all covariates shown in Exhibit 3 except for self-rated general and mental health status and difficulties with activities of daily living. We excluded these latter three variables because they were assessed in the 2013 survey and could have been influenced by the care patients received in 2012 or early 2013.
Exhibit 3.
Adjusted differences in use of preventive services, use of acute care, and total Medicare spending between patients served by high-priced versus low-priced practices
| Outcome | Overall Mean | Adjusted Difference between high-priced and low-priced practices a | 95% Confidence Interval | P-value |
|---|---|---|---|---|
| Receipt of Preventive Services, % | ||||
| Influenza vaccine in last 1 year | 77.8 | 1.49 | (0.39, 2.59) | 0.008 |
| Ever received pneumococcal vaccine b | 77.5 | 1.75 | (0.56, 2.94) | 0.004 |
| Preventive and management services for diabetes c | ||||
| Glycated hemoglobin testing in last 1 year | 77.4 | 1.43 | (−0.77, 3.63) | 0.20 |
| Low-density lipoprotein cholesterol testing in last 1 year | 82.9 | 0.14 | (−1.80, 2.08) | 0.89 |
| Diabetic retinal examination in last 2 years | 78.3 | 0.26 | (−1.80, 2.36) | 0.81 |
| Breast cancer screening (mammogram in last 2 years) d | 73.7 | −0.06 | (−3.93, 3.82) | 0.98 |
| Acute Care Use, No. of Episodes Per Year | ||||
| Emergency department visits not related to inpatient admissions | 0.481 | 0.008 | (−0.019, 0.035) | 0.57 |
| Acute hospitalizations | 0.238 | 0.009 | (−0.004, 0.023) | 0.18 |
| Hospitalizations for Ambulatory Care Sensitive Conditions | 0.034 | 0.002 | (−0.003, 0.008) | 0.38 |
| Total Annual Medicare Spending, $ e | 8305 | 112 | (−240, 465) | 0.53 |
Source: Authors’ analyses of CAHPS survey data, linked fee-for-service Medicare claims, and commercial insurer prices from FAIR Health.
Notes:
Estimates are for the adjusted difference in each outcome variable for patients of high-priced practices, relative to patients of low-priced practices. Estimates are adjusted for geography at the level of Primary Care Service Areas (PCSAs) and for all patient-level characteristics in Exhibit 2 except for self-rated general health, self-rated mental health, and functional limitations. All estimates are also adjusted for CAHPS survey weights.
Among patients ≥ 65 years old.
Among patients with a diagnosis of diabetes by the beginning of 2012 based on the Medicare Chronic Conditions Data Warehouse.
Among women 65–69 years old.
Includes all fee-for-service Medicare spending except for rehabilitation facility and long-term acute care facility spending.
The regressions estimate average differences in quality and utilization between high-priced and low-priced practices located in the same PCSA (for patients living in the same PCSA), controlling for all area-level factors that affect prices, quality, and demand. To facilitate interpretation of differences in patient experiences between high-priced and low-priced practices, we calculated effect sizes by dividing differences on the original survey scale by the standard deviation of the between-area variation (Appendix18). All analyses were adjusted for CAHPS survey weights.
We examined the extent to which differences in patient characteristics could have explained differences in quality by comparing all observed characteristics of patients between high-priced and low-priced practices and by comparing regression estimates before vs. after adjustment for these characteristics. In a sensitivity analysis, we additionally adjusted for self-reported general and mental health status and difficulties with activities of daily living.
In addition, we compared structural characteristics of high-priced and low-priced practices that might be related to differences in prices, quality, or efficiency. These included practice size (number of clinicians billing office visits under the practice’s TIN in FAIR Health claims), specialty mix (proportion of physicians who are primary care physicians), and participation in the Medicare Provider Quality Reporting System (PQRS) and Electronic Health Record (EHR) Incentive Program, as determined from the Medicare Physician Compare Initiative (Appendix18).27
We conducted four supplemental analyses. First, we estimated the relationship between practice size (instead of prices) and performance on measures of quality and efficiency, categorizing practices as large or small based on whether their size (as defined by number of clinicians) was above or below average in their PCSA (Appendix18). Because we conducted within-PCSA comparisons, this approach is equivalent to categorizing practices based on their market share within PCSAs. Second, we relaxed the geographic requirement that patients received primary care from practices located in the same PCSAs in which they resided. Third, we modeled price as a continuous rather than dichotomous variable. Fourth, in the subset of PCSAs containing ≥5 high-priced practices, we assessed the relationship between prices and quality above the area-level average price.
Limitations
Our study had several limitations. First, we could only assess practice quality to the extent allowable by the data, but the CAHPS survey data and linked claims supported a broad set of measures. Second, although Medicare beneficiaries attributed to high-priced and low-priced practices were similar on observable demographic and health characteristics — suggesting that patients did not sort to providers on attributes which could influence the use or quality of care — our observational study design could not rule out the possibility that unobserved differences between patients affected our results.
Third, although our focus on Medicare beneficiaries mitigated bias from patient sorting to high-priced versus low-priced providers based on the ability to pay for care, it required us to assume that prices for commercially-insured patients had the same relationship to quality of care for all patients in a given practice. This assumption is supported by prior research showing that determinants of care quality, including physician practice styles, tend to be similar for patients with different insurance within the same practices.28,29
Fourth, we could not assess prices of hospital owned practices due to a lack of outpatient facility claims in FAIR Health. Thus, our analysis is limited to comparisons of high-priced vs. low-priced practices billing as independent physician groups. Fifth, our within-area comparisons do not support inferences about the effects of provider market structure on quality. Finally, approximately half of beneficiaries responded to the CAHPS survey, but response rates did not differ between patients of high-priced vs. low-priced practices, and survey non-response did not cause appreciable differences in the characteristics of patients served by high-priced vs. low-priced practices.
RESULTS
Among Medicare beneficiaries in the CAHPS sample who were otherwise eligible for analysis, the survey response rate was 50.3% and was similar for beneficiaries attributed to high-priced (50.6%) and low-priced (49.9%) practices. After exclusions (Appendix Exhibit 118), our study sample consisted of 31,267 survey respondents, of whom 17,130 were attributed to 4,972 high-priced practices and 14,137 to 6,697 low-priced practices.
High-priced practices received an average of $84.43 for a CPT 99213 office visit, compared with $62.06 for low-priced providers, a 36% relative difference (P<0.001). Although we used prices for CPT 99213 claims to identify high-priced and low-priced practices, the price difference for a higher level office visit (CPT 99214) was similarly large (Exhibit 1).
Exhibit 1.
Characteristics of CAHPS Respondents Attributed to Practices with Above- versus Below-Average Prices
| High-Priced Practices (n=4,972) |
Low-Priced Practices (n=6,697) |
P-valuea | |
|---|---|---|---|
| Number of patients | 17,130 | 14,137 | – |
| Mean Price of CPT 99213 ($) b | $84.45 | $62.06 | <0.001 |
| Mean Price of CPT 99214 ($) | $123.97 | $93.28 | <0.001 |
|
| |||
| Patient Characteristics: c | |||
| Age (years) | 74.3 | 74.3 | 0.98 |
| Female (%) | 59.3 | 59.1 | 0.70 |
| Race/Ethnicity (%) | |||
| White | 83.1 | 82.0 | 0.12 |
| Black | 5.3 | 5.8 | |
| Hispanic | 3.5 | 3.9 | |
| Other | 8.1 | 8.4 | |
| Education (%) d | |||
| Less than High School | 14.2 | 15.3 | 0.06 |
| High School | 34.7 | 34.7 | |
| Some College | 25.6 | 25.6 | |
| College Graduate | 11.1 | 10.7 | |
| Graduate Education | 14.5 | 13.7 | |
| Supplemental and Prescription Drug Insurance (%) d | 85.8 | 86.0 | 0.66 |
| Medigap | 24.2 | 23.8 | 0.49 |
| Employer-sponsored | 27.5 | 26.7 | 0.21 |
| TRICARE/Veterans’ Administration | 10.0 | 10.7 | 0.07 |
| Other | 13.3 | 13.7 | 0.43 |
| Prescription drug coverage | 38.7 | 37.7 | 0.13 |
| Medicaid recipient (%) | 11.6 | 12.0 | 0.37 |
| Disabled (%) e | 16.0 | 15.7 | 0.62 |
| Current Smoker (%) d | 9.6 | 9.6 | 0.92 |
| Required help to complete CAHPS survey (%) d | 8.9 | 9.8 | 0.02 |
| Lives alone (%) d | 34.4 | 34.0 | 0.51 |
| End-stage renal disease (%) | 0.7 | 0.7 | 0.94 |
| Number of chronic conditions f | 6.32 | 6.44 | 0.01 |
| Hierarchical Condition Categories (HCC) score g | 1.26 | 1.28 | 0.12 |
| Difficulty with ≥1 activity of daily living (%) d,h | 37.6 | 38.3 | 0.31 |
| Self-Reported General Health (Mean Score) d, i | 3.04 | 3.03 | 0.32 |
| Self-Reported Mental Health (Mean Score) d, i | 3.60 | 3.57 | 0.01 |
Source: Authors’ calculations from the CAHPS survey linked to commercial insurer prices from FAIR Health.
Notes:
P-value for the difference in means or proportions of patients with a given characteristic attributed to high-price vs. low-price practices, adjusted for geography at the PCSA level.
Prices calculated from 2014 outpatient office claims reported in FAIR Health. The average price for CPT 99213 was used to identify high-price and low-priced practices, but was highly correlated with the price of a higher-level evaluation and management service (CPT 99214) within the same provider practice-insurer pairs (correlation=0.97). CPT denotes Current Procedural Terminology.
Patient-level characteristics are adjusted for CAHPS survey weights. The main regression models were adjusted for area fixed effects at the level of Primary Care Service Areas (PCSAs) and all patient characteristics shown in the table, except for self-rated general health, self-rated mental health, and functional limitations, which were included as covariates in a sensitivity analysis (Appendix Exhibit 818). Unless otherwise noted, all patient characteristics were assessed from the Medicare enrollment files. CAHPS denotes the Consumer Assessment of Healthcare Providers and Systems survey.
Assessed from the CAHPS survey.
Disability was original reason for Medicare eligibility.
Chronic conditions from the Chronic Conditions Data Warehouse (CCW) include the following 27 chronic conditions: Alzheimer’s disease, Alzheimer’s disease and related disorders or senile dementia, anemia, asthma, atrial fibrillation, benign prostatic hyperplasia, breast cancer, cataract, chronic kidney disease, chronic obstructive pulmonary disease, colorectal cancer, depression, diabetes, endometrial cancer, glaucoma, heart failure, hip or pelvic fracture, hyperlipidemia, hypertension, hypothyroidism, ischemic heart disease, lung cancer, osteoporosis, prostate cancer, acute myocardial infarction, rheumatoid arthritis, and stroke or transient ischemic attack. Regression analyses were adjusted for indicators for each of these 27 chronic conditions as well as the patient’s count of chronic conditions (≥ 6 or ≥ 9).
Hierarchical Condition Categories (HCC) risk scores are derived from demographic and diagnostic data in Medicare enrollment and claims files, with higher risk scores indicating higher predicted spending in the subsequent year. For each beneficiary in the study sample, we assessed the HCC score on the basis of enrollment and claims data in the prior year.
Limitations assessed are difficulties bathing, dressing, eating, using chairs, walking, and using the toilet.
Assessed on a 1-5 scale, where 1 indicates poor health and 5 indicates excellent self-rated health.
Patients attributed to high-priced and low-priced providers differed minimally on all measured characteristics (Exhibit 1). Statistically significant but small differences were observed in the number of chronic conditions, mental health status, and use of a helper to complete the survey.
Patient Experiences with Care
Experiences with care did not differ between patients served by high-priced and low-priced practices in 3 of the 4 domains (overall ratings of care and physicians, timely access to care, and interactions with primary physician), except for one item (Exhibit 2). Specifically, patients served by high-priced practices were modestly more likely to see their doctor within 15 minutes of a scheduled appointment.
Exhibit 2. Adjusted differences in experiences with care between patients served by high-priced versus low-priced practices.
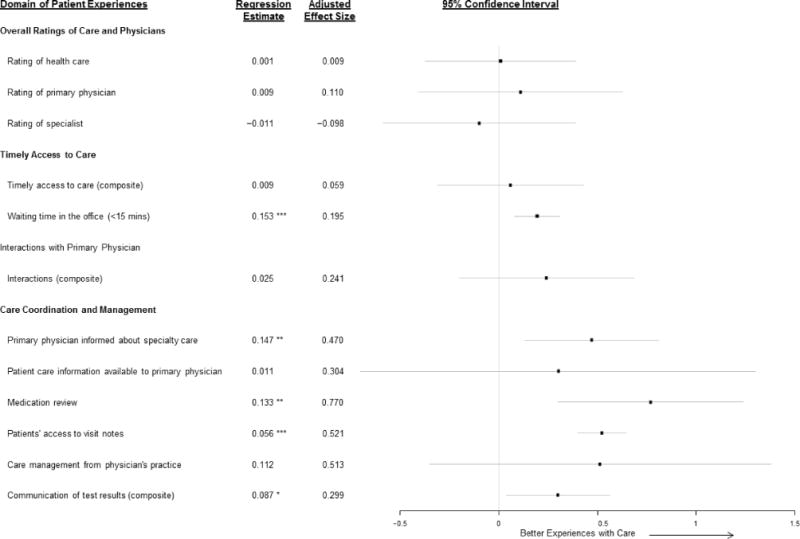
Source: Authors’ analyses of CAHPS survey data and linked commercial insurer prices from FAIR Health.
Notes: This figure displays adjusted differences in patients’ experiences with care for patients attributed to high-priced versus low-priced practices. Error bars indicate 95% confidence intervals. Differences are adjusted for geography at the level of Primary Care Service Areas (PCSAs) as well as all patient-level characteristics in Exhibit 2 except for self-rated general health, self-rated mental health, and functional limitations. To facilitate interpretation of differences in performance on measures of patient experiences between high-priced and low-priced practices, we calculated effect sizes by dividing differences on the original survey scale by the standard deviation of the variance of mean scores across areas, which we estimated using a multi-level regression model with random effects for areas (see Appendix18). An effect size of 0.5 standard deviations is analogous to the difference in care experiences between the average area (50th percentile) and an area at the 69th percentile. All estimates are adjusted for CAHPS survey weights.
aComposite of 3 questions: (1) When you needed care right away for an illness, injury, or condition, how often did you get care as soon as you needed it?; (2) How often did you get an appointment for your health care at a doctor’s office or clinic as soon as you thought you needed it (not counting the times you needed care right away)?; (3) How often was it easy to get appointments to specialists?
bComposite of 4 questions: In the past 6 months, how often did your personal doctor: (1) Explain things in a way that was easy to understand; (2) Listen carefully to you; (3) Show respect for what you had to say; (4) Spend enough time with you?
cComposite of 2 questions: In the past 6 months, when your personal doctor ordered a blood test, x-ray, or other test: (1) How often did someone from your personal doctor’s office follow up to give you those results; (2) How often did you get those results as soon as you needed them?
Statistical significance is denoted as follows: *p<0.05, **p<0.01, ***p<0.001.
In the fourth domain (care coordination and management), patients of high-priced practices reported better performance on 4 of 6 items, with effect sizes of approximately 0.5 standard deviations or greater for 3 of these items. These effect sizes are analogous to the difference between a geographic area with average performance (i.e., at the 50th percentile) and an area at the 69th percentile of performance or higher (Exhibit 2 and Appendix18).
Use of Preventive and Acute Care and Medicare Spending
Compared with patients of low-priced practices, patients of high-priced practices were slightly, but significantly, more likely to receive influenza and pneumococcal vaccinations. Receipt of mammography, preventive and management services for diabetes, acute care use, and total Medicare spending did not differ between patients of high-priced and low-priced practices (Exhibit 3).
Practice Characteristics
As described in Exhibit 4, high-priced practices were much larger than low-priced practices (122 vs. 34 clinicians on average) and had lower proportions of clinicians who were primary care physicians (58.5% vs. 72.9%). High-priced practices also were more likely than low-priced practices to participate in the Medicare EHR Incentive Program (52.3% vs. 38.0%) and to report quality measures through the Medicare Provider Quality Reporting System (69.7% vs. 53.6%).
Exhibit 4.
Characteristics of practices by price a
| Characteristic | High-Priced Practices | Low-Priced Practices |
|---|---|---|
| Average number of clinicians billing under the TIN b | 121.7 | 34.4 |
| % of clinicians in the practice who are primary care providers c | 58.5 | 72.9 |
| % of clinicians participating in the Medicare Provider Quality Reporting System (PQRS) | 69.7 | 53.6 |
| % of clinicians participating in the Medicare Electronic Health Record (EHR) incentive program | 52.3 | 38.0 |
Source: Authors’ calculations using FAIR Health claims linked to the CAHPS and the Medicare Compare physician database.
The figures in this table are practice-level averages.
Includes physicians and non-physician clinicians.
Comparisons by Practice Size
Results were very similar when comparing practices by their size rather than their prices. Practices categorized as large were nearly 15 times larger than small practices (155 vs. 11 clinicians on average) and received prices for CPT 99213 office visits that were 20% higher (mean price: $81.09 vs. $67.55; P<0.001). Patients of large practices reported significantly better performance on 2 of the same items related to care coordination and management that high-priced practices performed better on and were slightly more likely to receive pneumococcal and influenza vaccination. All other measures of patient experiences, receipt of other preventive and diabetes services, acute care utilization, and total Medicare spending did not differ for patients of large vs. small practices (Appendix18).
Additional Analyses
We obtained similar results when modeling quality and use of care as a function of a continuous price variable (Appendix Exhibit 418). In PCSAs with ≥5 practices charging above-average prices, we found only one significant and positive association between prices above the PCSA average and performance on quality of care—specifically for patients’ access to visit notes (Appendix Exhibit 518). Thus, the higher patient ratings of care coordination and management associated with higher prices were present for practices with average prices and did not increase further in higher-priced practices. We obtained similar results when comparing practices within counties (rather than PCSAs), when not adjusting for patient characteristics, and when adjusting for additional patient characteristics from the CAHPS survey (Appendix Exhibits 6–818).
DISCUSSION
In this national study of commercial prices paid to physician practices and the quality and efficiency of care that practices provide to Medicare beneficiaries, we found that higher prices were associated with higher patient ratings of care coordination and management and slightly higher vaccination rates. Higher prices, however, were not associated with higher overall patient ratings of care or physicians, improved access, better performance on other process measures of quality, fewer hospitalizations, or lower Medicare spending. These findings suggest limited gains for patients and purchasers from using high-priced practices.
High-priced practices were much larger than low-priced practices, and results were similar in comparisons by practice size, suggesting that larger provider groups with market power are able to command substantially higher prices without having to offer markedly better care. We did find evidence that larger and high-priced practices have more advanced systems to support care coordination and management, both in their performance on relevant CAHPS measures and their engagement in Medicare programs promoting quality reporting and EHR development. These findings are consistent with prior research demonstrating that larger provider organizations exhibit greater structural capacity for supporting care management and quality improvement.30,31 Our findings are also consistent with evidence that practices do not achieve greater economies of scale beyond modest size thresholds.1,32 Specifically, higher prices above the area average were not associated with better performance, suggesting that provider organizations with the market power to obtain particularly high prices performed no better than an average-priced practice.
Moreover, the enhanced care coordination and management exhibited by high-priced practices did not extend to other domains of quality, including access to care and use of potentially preventable acute care. This is consistent with prior research, which has found modestly better or even worse patient outcomes associated with larger provider organizational size.8,13,14 Our study and most prior research reflects the relationship between price and quality in the context of fee-for-service payment, whereas some contend that larger (and higher priced) provider organizations could leverage their structural capabilities to deliver more efficient and higher quality care under new payment models that explicitly reward these goals. Studies to date, however, provide no evidence that larger health systems have been more responsive than smaller organizations to new payment models such as Accountable Care Organization models.22,33,34 Thus, our findings suggest that the benefits to patients from large-scale provider consolidation may be small relative to the price increases that occur when consolidating providers gain market power.
The generally weak association that we found between practices’ prices and quality of care deviates from the positive relationship that exists in markets for most other goods and services. This underscores longstanding information problems in health care markets, arising in particular from the inability of patients and payers to reliably discern differences in provider quality.7 This problem has important implications for transparency initiatives that aim to use information on price and quality to steer patients to high-value providers. If quality cannot be measured or conveyed as well as prices, for example, consumers may perceive higher prices as a signal of better quality. Under that scenario, our results suggest that transparency initiatives might have the unintended effect of steering patients to high-priced providers who are no more efficient in the provision of care and whose impact on quality may be small. As efforts to measure, report, and base payment on quality intensify, it will be important to monitor the relationship between price and quality and understand its implications for health care spending and quality.22,33
Conclusion
In conclusion, we found that Medicare patients in practices negotiating above-average prices with commercial insurers reported better care coordination and management in some respects but otherwise did not receive care that was more valuable, compared to lower-priced practices in the same areas. These findings do not support claims that high-priced providers deliver substantially higher-value care.
Appendix
I. Analytic Sample
Our sample consisted of respondents to the 2012 Medicare Consumer Assessment of Healthcare Providers and Systems (CAHPS) survey who were continuously enrolled in Medicare Parts A and B from 2011–2012 and who received at least one primary care service from a physician in 2012. We identified primary care services using procedure codes (Healthcare Common Procedure Coding System codes 99201–99215, G0438, and G0439) and physician specialty codes, limiting the set of eligible services to those performed by general practice, family practice, internal medicine, or geriatric physicians (identified by Medicare specialty codes 1, 8, 11, and 38, respectively) in the Medicare carrier claims file. These inclusion criteria yielded an initial sample of 75,395 Medicare beneficiaries who responded to the CAHPS survey.
We assigned each of these eligible individuals to a single practice (identified using Taxpayer Identification Numbers (TINs)) that provided the plurality of the respondent’s 2012 outpatient primary care. To do this, we attributed patients to the TIN that billed the greatest number of primary care services, or in the case of ties, total allowed charges for these services. Remaining ties were resolved by assigning patients to the TINs that billed the patient’s final 2012 primary care service. This assignment algorithm generally follows Step 1 of the Centers for Medicare and Medicaid Service’s process for attributing Medicare beneficiaries to Medicare Accountable Care Organizations, and is also a component of the attribution method used to assign beneficiaries to provider organizations for claims-based measures of quality and spending in Medicare’s Value-Based Payment modifier program.1
Each TIN was linked to its average negotiated price with a large commercial insurer in the TIN’s area for a representative office service. Because we sought to examine the relationship between within-area differences in providers’ prices and quality, our final sample consisted of CAHPS survey respondents who were attributed to TINs in geographic areas (defined as Primary Care Service Areas (PCSAs)) with ≥ 2 differently priced TINs. Our main sample consisted of CAHPS survey respondents who were attributed to TINs in respondents’ PCSAs, yielding a sample of 31,267 individuals. Of these 31,267 individuals, 14,137 were attributed to TINs with below-average prices in their PCSAs, while 17,130 were attributed to TINs with above-average prices.
Appendix Exhibit 1, on the following page, shows the derivation of our analytic sample.
Appendix Exhibit 1. Study Sample and Inclusion Criteria.
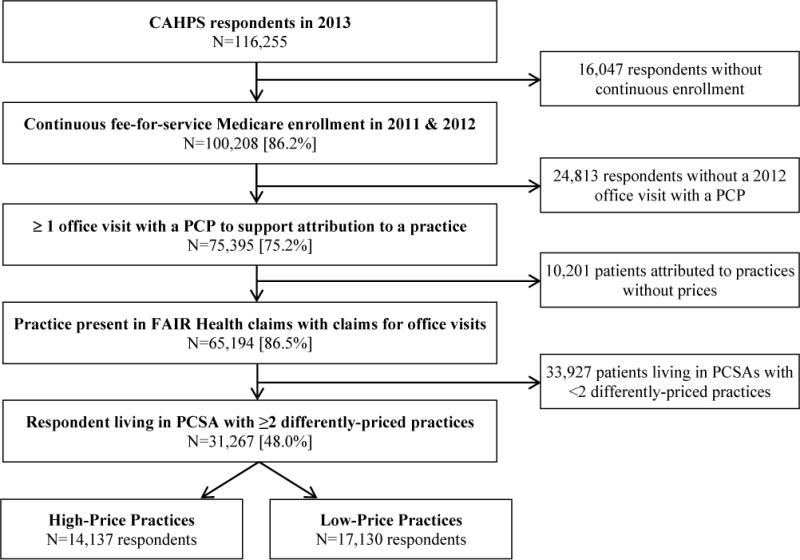
Notes: [brackets] denote the proportion of the sample retained after applying the immediately preceding exclusion criterio.
II. Background on FAIR Health Data
The FAIR Health dataset comprises claims from approximately 60 national and regional insurers in the United States. The database was formed as part of a settlement between the New York State Attorney General and insurers regarding their out-of-network billing practices. It has since grown to include claims paid by private insurers across the United States, providing a rich source of information about the prices of specific health care services. The database allows us to identify the provider NPI as well as the Taxpayer Identification Number (TIN) of practices. We observe “allowed amounts” for claims, which include insurer payments to practices as well as patient co-payments (if any). We used the allowed amounts to measure the prices negotiated between practices and commercial insurers, as discussed below.
III. Construction of TIN-Level Average Prices
We used 2014 health care claims from FAIR Health to measure a commercial prices received by physician practices. To construct our price measure, we analyzed all professional office claims (place of service code 11) to a large insurer in the practice’s area billed by physicians with Current Procedural Terminology (CPT) code 99213, the most commonly billed evaluation and management service in the office setting (accounting for approximately 11% of office claims billed by physicians, and 37% of office evaluation and management claims, in 2014 FAIR Health data). To improve the precision of our estimate of TIN-level prices, we excluded claims with procedure modifier codes, those billed by non-physician providers (e.g., nurse practitioners), and claims not billed to Preferred Provider Organization or Point of Service plans. To mitigate the influence of outliers, we top coded prices at the 99th percentile of the price distribution for all CPT 99213 claims and excluded claims with $0 prices, which we interpreted as being paid under capitation arrangements.
We also excluded claims with implausibly low (but >$0) prices. To remove these claims, we identified each TIN’s first and second most commonly price reported on claims with CPT code 99213. Within each TIN, we generally observed a modal price (averaging approximately $70 across TINs) in addition to a substantially lower and less frequently billed price, which ranged from $10–$21 across TINs. Because these were not the most commonly reported prices on the TIN’s claims (and therefore were unlikely to reflect a provider’s “base” negotiated rate for the service), we excluded claims with prices below $21 prior to constructing TIN-level average prices. Among the remaining claims, the prices of approximately 84% of observations were equal to the modal price billed by TINs, and 93% were within $10 of this modal price.
We computed each TIN’s price as the average allowed amount among all claims meeting these inclusion criteria. We compared this TIN-level average price to the average price of all practices within the same PCSAs to identify high- and low-price TINs (i.e., those with prices above or below the PCSA average, respectively), which served as the main independent variable in our regression analyses.
We included prices for office visits with either primary care physicians or specialists because prices were very similar for primary care and specialist physicians in the same practice, differing by <$1, on average, in multi-specialty practices. Further, the modal price received by specialists was identical to the modal price received by primary care physicians within 72% of multi-specialty practices, and differed by <$5 for 80% of multi-specialty practices. The rate of concordance did not vary with the mix of specialists vs. primary care physicians in a practice.
Note that we used 2014 claims to obtain prices, since these claims in the FAIR Health database most frequently reported practice TINs, and because negotiated prices for 2014 likely reflected providers’ bargaining power and quality of care in prior periods. For TINs billing the same insurer in 2013 and 2014, we found that negotiated prices were highly correlated (rho=0.90) between adjacent years. In addition, for providers billing both CPT 99213 and CPT 99214 (a higher-level service used for longer-length visits for patients with greater medical complexity) claims to the same insurers, prices were highly correlated (rho=0.97).
IV. Data Linkage
We linked CAHPS survey data and patient claims for Medicare beneficiaries to their attributed practice’s commercial insurance prices. We derived our analytic sample from the 2013 fee-for-service Medicare CAHPS survey, limiting our sample to beneficiaries who were continuously enrolled in Part A and Part B Medicare coverage from 2011 – 2012, and who had at least one primary care physician visit in 2012. Because the CAHPS survey is administered early in the calendar year, and asks respondents to rate the care of their primary care providers over the prior six months, the reference period of the 2013 CAHPS survey encompassed primary care services provided in the latter half of 2012 and in early 2013. Accordingly, we used 2012 Medicare claims to attribute respondents to practice TINs, and to assess concurrent rates of preventive service and acute care use, and medical spending. We evaluated two CAHPS measures of preventive service use (flu and pneumonia shots) and four claims-based measures, which were based on HEDIS guidelines. Two of these claims-based measures have lookback periods of two years; for these measures, we examined patients’ 2011 and 2012 Medicare claims.
Each CAHPS survey respondent was attributed to a single TIN that provided the plurality of the patient’s primary care services rendered by a physician in 2012, using the assignment method described above. We linked these TINs to measures of their 2014 prices as described above.
V. Measurement of Practice Characteristics
We used two data sources to assess differences in the characteristics of high-price and low-price practices that may be related to their care coordination and management capabilities.
First, using all 2014 FAIR Health professional claims for office services (for all insurers in the dataset), we measured the size of practices based on the number of unique clinicians (identified by National Provider Identifiers) that billed the plurality of primary care office services to a given TIN. We assigned each NPI to a single TIN, using the plurality of claims, or in cases of ties, the largest share of negotiated payments, to make this determination. We then calculated the number of unique NPIs attributed to a TIN using this claims-based attribution rule, and compared the mean number of NPIs attributed to high-price versus low-price TINs. We also assessed the fraction of physicians within a TIN with primary care specialties, using data from the National Plan and Provider Enumeration System file to construct this proportion.
Second, we used data from the Medicare Physician Compare national downloadable file (updated as of May 1, 2016) to assess the participation of NPIs in the Medicare Physician Quality Reporting System (PQRS) Incentive Program and in the Medicare Electronic Health Record (EHR) Incentive Program. The Physician Compare file reports individual provider characteristics at the level of NPI-practice location locations. We determined that PQRS and EHR participation were both reported identically for all location records of the same NPI. Accordingly, we collapsed these data to construct an NPI-level record of PQRS and EHR participation, which we merged onto an NPI-to-TIN crosswalk constructed using Medicare claims linked to the CAHPS survey. This crosswalk assigns NPIs to TINs based on a plurality billing (or in the case of ties, greatest share of allowed charges) rule. Finally, we constructed a TIN-level variable that represented the average percentage of NPIs within either high-priced or low-priced TINs that participated in the PQRS or EHR incentive programs. The results of these analyses are presented in Exhibit 4 of the main manuscript.
VI. Study Measures and Response Rates
Appendix Exhibit 2 provides information about the CAHPS survey and claims-based measures that we evaluated. The table describes the CAHPS survey questions we analyzed, the rating scale of the survey item, and non-response rate for each item (stratified by high-price and low price TINs). Non-response could occur if the particular measure did not apply to the patient, or (for CAHPS survey questions only) because the person did not supply a valid response to a survey item. (For claims-based measures, we observe all utilization and spending for persons meeting the study inclusion criteria.) The rates of non-applicable or missing responses per item did not differ substantially between individuals attributed to high-price versus low-price TINs. Our regression models were run only on individuals for which a given measure applied, and for which a patient supplied a valid response in the CAHPS survey.
Appendix Exhibit 2.
Description of CAHPS survey items and claims-based measures of utilization and spending
| High-Priced TINs (n=17,130 patients) | Low-Priced TINs (n=14,137 patients) | ||||
|---|---|---|---|---|---|
|
| |||||
| Domain/Item | Scale† | % Non-Applicable | % Applicable but Missing‡ | % Non-Applicable | % Applicable but Missing‡ |
| Experiences with Care | |||||
|
| |||||
| Overall Ratings of Care and Physicians | |||||
|
| |||||
| Rating of health care | 0–10 | 0% | 11.4% | 0% | 11.9% |
| Rating of primary physician | 0–10 | 1.9% | 13.2% | 1.8% | 12.5% |
| Rating of specialist | 0–10 | 35.1% | 3.9% | 34.9% | 4.7% |
|
| |||||
| Timely Access to Care | |||||
|
| |||||
| Timely access to care (3-item composite): | |||||
| In the past 6 months: | |||||
|
1–4 | 59.4% | 3.7% | 59.1% | 3.7% |
|
1–4 | 12.1% | 3.9% | 11.9% | 4.3% |
|
1–4 | 33.8% | 14.8% | 33.6% | 15.1% |
| Waiting time in the office | 1–4 | 0% | 12.6% | 0% | 13.2% |
|
| |||||
| Interactions with Primary Physician | |||||
|
| |||||
| Interactions with primary physician (4-item composite): | |||||
| In the past 6 months, how often did your personal doctor: | |||||
|
1–4 | 1.9% | 13.2% | 1.8% | 12.3% |
|
1–4 | 1.9% | 13.1% | 1.8% | 12.3% |
|
1–4 | 1.9% | 13.2% | 1.8% | 12.3% |
|
1–4 | 1.9% | 13.2% | 1.8% | 12.3% |
|
| |||||
| Care Coordination and Management | |||||
|
| |||||
| Primary physician informed about specialty care | 1–4 | 35.1% | 10.1% | 34.9% | 10.8% |
|
| |||||
| Patient care information available to primary physician | 1–4 | 1.9% | 13.2% | 1.8% | 12.4% |
|
| |||||
| Medication review | 1–4 | 3.7% | 13.5% | 3.8% | 12.8% |
|
| |||||
| Patients’ access to visit notes | Yes/No | 1.9% | 15.3% | 1.8% | 14.9% |
|
| |||||
| Care management from physician’s practice | 1–3 | 66.7% | 16.3% | 67.2% | 16.0% |
|
| |||||
| Communication of test results (2-item composite): | |||||
| In the past 6 months, when personal doctor ordered a blood test, x-ray, or other test: | |||||
|
1–4 | 11.1% | 14.2% | 11.4% | 13.7% |
|
1–4 | 11.1% | 17.3% | 11.4% | 17.6% |
|
| |||||
| Use of Preventive Services | |||||
|
| |||||
| Influenza vaccine in last 1 year | Yes/No | 0% | 4.0% | 0% | 4.4% |
|
| |||||
| Pneumococcal vaccine (ever) | Yes/No | 0% | 8.5% | 0% | 9.2% |
|
| |||||
| Preventive services for diabetes¶ | |||||
|
Binary | 71.5% | – | 69.2% | – |
|
Binary | 71.5% | – | 69.2% | – |
|
Binary | 71.5% | – | 69.2% | – |
|
| |||||
| Breast cancer screening (mammogram in last 2 years) ˆ | Binary | 85.8% | – | 85.6% | – |
|
| |||||
| Utilization and Spending | |||||
|
| |||||
| Emergency department visits not related to inpatient admissions | Count | 0% | – | 0% | – |
|
| |||||
| Acute hospitalizations | Count | 0% | – | 0% | – |
|
| |||||
| Hospitalizations for Ambulatory Care-Sensitive Conditions | Count | 0% | – | 0% | – |
|
| |||||
| Total Annual Spending, $ | $ 2012 | 0% | – | 0% | – |
For numeric scores, scales range from 0 (worst) to 10 (best); from 1 (never) to 4 (always); or have values of 1 (no), 2 (yes, somewhat), or 3 (yes, definitely). Prior to analysis, numeric scores were converted to a consistent 0–10 scale. For items that are part of composite scores, we first subtracted the overall mean for the item and then calculated a patient-level composite score as an equally weighted average of all items for which a patient provided a valid response.
Assessed from responses to the CAHPS survey. CAHPS denotes the Consumer Assessment of Healthcare Providers and Systems survey.
For diabetes preventive services, the population assessed consisted of eligible CAHPS respondents who had a diagnosis of diabetes by the beginning of 2011 based on the Medicare Chronic Conditions Data Warehouse.
Among women 65–69 years old.
Assessed from 2012 Medicare fee-for-service claims. Includes all spending except for rehabilitation facility and long-term acute care facility spending.
Source: Authors’ analyses of CAHPS survey data, linked fee-for-service Medicare claims, and commercial insurer prices from FAIR Health.
VII. Statistical Analyses
We examined regression-adjusted associations between using a high-price vs. a low-price practice within a geographic area, and patient experiences with care, use of preventive services, hospitalizations, and health care spending. For each outcome variable, we estimated regression models of the form:
swhere y denotes the outcome (e.g., experiences with care, or use of services) measured for patient i attributed to practice TIN j (on the basis of 2012 primary care services) in geographic area m. The main independent variable of interest was an indicator that the price of provider (TIN) j was above (versus below) the mean for all TINs in the same area, i.e., . We controlled for a vector of patient-level characteristics ( ) and area fixed effects, . Our main analyses assessed differences between practices within Primary Care Service Areas (PCSAs), and were limited to patients attributed to practices in the same PCSAs in which they resided. In a sensitivity analysis (Appendix Exhibit 6), we included respondents attributed to any practice and categorized each respondent’s practice based on its price relative to the average price for practices in the same county. The parameter of interest in this model was , which represents the average within-PCSA difference in the outcome y among patients attributed to practices with above- vs. below-average prices in a PCSA. All analyses were limited to the PCSAs in which we could identify ≥ 2 TINs with different prices linked to CAHPS survey respondents meeting our sample inclusion criteria.2
Appendix Exhibit 3 (following page) summarizes our regression estimates for the within-PCSA association between having a high-price vs. low-price practice and each outcome variable. The results shown are adjusted for all covariates noted in Exhibit 1 of the main manuscript, except for self-rated general health, self-rated mental health, and functional limitations. To facilitate comparisons with our sensitivity analyses, estimates in this table are reported on the original scale in which the outcome variables are measured.
For CAHPS survey measures of patient experiences, which are rated on an ordinal scale (see the Appendix Exhibit 2), we reported standardized differences (i.e., effect sizes) in quality associated with visiting a high-price versus a low-price practice. These effect sizes were estimated by dividing our regression estimate of by an estimate of the standard deviation of the mean rating for the corresponding experience measure across geographic areas, which we obtained from a multi-level regression model with area random effects. These multi-level models were of the form:
with , , and . The effect sizes were calculated as follows:
Because relatively few patients were attributed to each TIN, precluding us from estimating the TIN-level variance in quality, we used the variation across geographic areas in calculating effect sizes. We used estimates of PCSA-level variances to construct these effect sizes, except in cases where the standard deviation of was greater across counties or Hospital Referral Regions, in which case we used the larger of these standard deviations. We reported un-scaled estimates for the use and spending outcome models, for which the outcome variables reflect either the proportion of patients receiving the recommend service, counts of services used, or medical spending.
Appendix Exhibit 3.
Adjusted differences in patient experiences, use of preventive services, use of acute care, and total Medicare spending between patients served by high-priced versus low-priced practices
| Outcome | Adjusted Difference High-Low Priced Practices† | 95% Confidence Interval | P-value |
|---|---|---|---|
| Experiences with Care | |||
|
| |||
| Overall Ratings of Care and Physicians | |||
| Rating of health care | 0.001 | (−0.046, 0.048) | 0.962 |
| Rating of primary physician | 0.009 | (−0.032, 0.050) | 0.678 |
| Rating of specialist | −0.011 | (−0.064, 0.043) | 0.696 |
| Timely Access to Care | |||
| Timely access to care (3-item composite) | 0.009 | (−0.050, 0.068) | 0.753 |
| Waiting time in the office | 0.153 | (0.063, 0.243) | 0.001 |
| Interactions with Primary Physician | |||
| Physician interaction (4-item composite) | 0.025 | (−0.021, 0.071) | 0.288 |
| Care Coordination and Management | |||
| Primary physician informed about specialty care | 0.147 | (0.041, 0.252) | 0.007 |
| Patient care information available to primary physician | 0.011 | (−0.026, 0.048) | 0.550 |
| Medication review | 0.133 | (0.052, 0.215) | 0.001 |
| Patients’ access to visit notes | 0.056 | (0.043, 0.069) | <.0001 |
| Care management from physician’s practice | 0.112 | (−0.077, 0.301) | 0.246 |
| Communication of test results (2-item composite) | 0.087 | (0.011, 0.164) | 0.026 |
|
| |||
| Use of Preventive Services, % within timeframe | |||
|
| |||
| Influenza vaccine in last 1 year | 1.49 | (0.39, 2.59) | 0.008 |
| Pneumococcal vaccine (ever) ‡ | 1.75 | (0.56, 2.94) | 0.004 |
| Preventive services for diabetics ˆ | |||
| Glycated hemoglobin testing in last 1 year | 1.43 | (−0.77, 3.63) | 0.202 |
| Low-density lipoprotein testing in last 1 year | 0.14 | (−1.80, 2.08) | 0.888 |
| Diabetic retinal examination in last 2 years | 0.26 | (−1.80, 2.36) | 0.812 |
| Breast Cancer Screening in last 2 years § | −0.06 | (−3.93, 3.82) | 0.976 |
|
| |||
| Acute Care Use, No. Per Year | |||
|
| |||
| Emergency department visits not related to inpatient admissions | 0.008 | (−0.019, 0.035) | 0.566 |
| Acute hospitalizations | 0.009 | (−0.004, 0.023) | 0.176 |
| Hospitalizations for Ambulatory Care Sensitive Conditions | 0.002 | (−0.003, 0.008) | 0.377 |
|
| |||
| Total Annual Spending, $ | |||
|
| |||
| Annual Spending ¶ | 112.18 | (−240.41, 464.77) | 0.533 |
Notes: This table shows the estimated association between visiting a provider practice with a high vs. a below-average price and patient experiences with care, the receipt of preventive services, acute care visits, and health care spending.
Estimates are adjusted for geography at the level of Primary Care Service Areas (PCSAs) and for all patient-level characteristics in Exhibit 1 of the main manuscript except for self-rated general health, self-rated mental health, and functional limitations. All estimates are also adjusted for CAHPS survey weights.
Among patients ≥ 65 years old.
Among patients with a diagnosis of diabetes by the beginning of 2011 based on the Medicare Chronic Conditions Data Warehouse.
Among women 65–69 years old.
Includes all fee-for-service Medicare spending except for rehabilitation facility and long-term acute care facility spending.
VIII. Sensitivity Analyses for High-Price versus Low-Price Practices
This section and Appendix Exhibits 4–8 summarize the results of our sensitivity analyses comparing high-price and low-price practices. In general, the sensitivity analyses demonstrate that our main results were robust to the categorization of practice prices (Appendix Exhibit 4) and to adjustment for patient-level characteristics (Appendix Exhibits 7 and 8). For outcomes in which we observed a positive association between price and quality, we generally found that this association did not increase above the PCSA mean. This suggests that, while practices with above-average prices provided higher quality care on certain dimensions of care coordination and management, few additional gains would accrue to patients from seeing a provider with prices higher than the average for their area (Appendix Exhibit 5). Finally, our comparison of provider prices within counties produced similar estimates as our main analyses, although here we found that patients of high-priced practice (relative to the county average) reported higher overall ratings of care, and were slightly more likely to have received diabetic retinal examinations (conditional on need; Appendix Exhibit 6). However, these county-level analyses may be less robust to unobserved differences between patients, because we did not limit our sample to patients receiving care from within-county providers, and because we observed somewhat greater differences in demographic characteristics and health status between patients of high-priced vs. low-priced practices in these within-county analyses.
Appendix Exhibit 4.
Adjusted associations between a $1 difference in price and practice performance on quality and efficiency measures
| Outcome | Adjusted Association † | 95% Confidence Interval | P-value |
|---|---|---|---|
| Experiences with Care | |||
|
| |||
| Overall Ratings of Care and Physicians | |||
| Rating of health care | 0.000 | (−0.002, 0.001) | 0.604 |
| Rating of primary physician | 0.001 | (−0.001, 0.002) | 0.291 |
| Rating of specialist | −0.001 | (−0.003, 0.000) | 0.142 |
| Timely Access to Care | |||
| Timely access to care (3-item composite) | 0.000 | (−0.002, 0.001) | 0.653 |
| Waiting time in the office | 0.004 | (0.001, 0.007) | 0.005 |
| Interactions with Primary Physician | |||
| Physician interaction (4-item composite) | 0.001 | (−0.001, 0.002) | 0.291 |
| Care Coordination and Management | |||
| Primary physician informed about specialty care | 0.005 | (0.001, 0.008) | 0.005 |
| Patient care information available to primary physician | 0.001 | (−0.001, 0.002) | 0.364 |
| Medication review | 0.003 | (0.001, 0.005) | 0.018 |
| Patients’ access to visit notes | 0.002 | (0.002, 0.003) | <.0001 |
| Care management from physician’s practice | 0.005 | (−0.001, 0.010) | 0.088 |
| Communication of test results (2-item composite) | 0.003 | (0.001, 0.005) | 0.011 |
|
| |||
| Use of Preventive Services, % within timeframe | |||
|
| |||
| Influenza vaccine in last 1 year | 0.05 | (0.01, 0.08) | 0.005 |
| Pneumococcal vaccine (ever) ‡ | 0.08 | (0.05, 0.12) | <.0001 |
| Preventive services for diabetics ˆ | |||
| Glycated hemoglobin testing in last 1 year | 0.06 | (0.00, 0.12) | 0.104 |
| Low-density lipoprotein testing in last 1 year | −0.01 | (−0.10, 0.06) | 0.834 |
| Diabetic retinal examination in last 2 years | 0.00 | (−0.10, 0.06) | 0.901 |
| Breast Cancer Screening in last 2 years § | −0.01 | (−0.12, 0.10) | 0.878 |
|
| |||
| Acute Care Use, No. Per Year | |||
|
| |||
| Emergency department visits not related to inpatient admissions | 0.000 | (0.000, 0.001) | 0.335 |
| Acute hospitalizations | 0.000 | (0.000, 0.001) | 0.666 |
| Hospitalizations for Ambulatory Care Sensitive Conditions | <0.001 | (−0.0001, 0.0003) | 0.302 |
|
| |||
| Total Annual Spending, $ | |||
|
| |||
| Annual Spending ¶ | −0.59 | (−12.44, 11.27) | 0.923 |
Notes: This table shows the estimated association between a provider practice’s price (measured on a continuous basis, relative to the Primary Care Service Area mean) and patient experiences with care, the receipt of preventive services, acute care visits, and health care spending.
Estimates are adjusted for geography at the level of counties and for all patient-level characteristics in Exhibit 1 of the main manuscript except for self-rated general health, self-rated mental health, and functional limitations. All estimates are also adjusted for CAHPS survey weights.
Among patients ≥ 65 years old.
Among patients with a diagnosis of diabetes by the beginning of 2011 based on the Medicare Chronic Conditions Data Warehouse.
Among women 65–69 years old.
Includes all fee-for-service Medicare spending except for rehabilitation facility and long-term acute care facility spending.
Appendix Exhibit 5.
Adjusted associations between a $1 difference in price and practice performance on quality and efficiency measures (limited to practices with above average prices in their PCSAs, and to PCSAs with ≥5 practices with above-average prices)
| Outcome | Adjusted Association † | 95% Confidence Interval | P-value |
|---|---|---|---|
| Experiences with Care | |||
|
| |||
| Overall Ratings of Care and Physicians | |||
| Rating of health care | −0.005 | (−0.010, 0.000) | 0.054 |
| Rating of primary physician | 0.001 | (−0.003, 0.005) | 0.749 |
| Rating of specialist | 0.000 | (−0.005, 0.006) | 0.955 |
| Timely Access to Care | |||
| Timely access to care (3-item composite) | −0.001 | (−0.007, 0.005) | 0.804 |
| Waiting time in the office | −0.001 | (−0.010, 0.008) | 0.784 |
| Interactions with Primary Physician | |||
| Physician interaction (4-item composite) | −0.001 | (−0.005, 0.003) | 0.675 |
| Care Coordination and Management | |||
| Primary physician informed about specialty care | −0.001 | (−0.011, 0.009) | 0.881 |
| Patient care information available to primary physician | 0.000 | (−0.003, 0.004) | 0.820 |
| Medication review | 0.001 | (−0.007, 0.009) | 0.793 |
| Patients’ access to visit notes | 0.003 | (0.002, 0.004) | <.0001 |
| Care management from physician’s practice | −0.001 | (−0.015, 0.013) | 0.853 |
| Communication of test results (2-item composite) | 0.004 | (−0.003, 0.012) | 0.234 |
|
| |||
| Use of Preventive Services, % within timeframe | |||
|
| |||
| Influenza vaccine in last 1 year | 0.05 | (−0.05, 0.16) | 0.319 |
| Pneumococcal vaccine (ever) ‡ | 0.11 | (0.00, 0.23) | 0.059 |
| Preventive services for diabetics ˆ | |||
| Glycated hemoglobin testing in last 1 year | 0.01 | (−0.22, 0.24) | 0.932 |
| Low-density lipoprotein testing in last 1 year | −0.15 | (−0.33, 0.04) | 0.122 |
| Diabetic retinal examination in last 2 years | 0.16 | (−0.06, 0.38) | 0.156 |
| Breast Cancer Screening in last 2 years § | 0.10 | (−0.27, 0.46) | 0.609 |
|
| |||
| Acute Care Use, No. Per Year | |||
|
| |||
| Emergency department visits not related to inpatient admissions | <0.001 | (−0.003, 0.003) | 0.803 |
| Acute hospitalizations | <0.001 | (−0.002, 0.001) | 0.606 |
| Hospitalizations for Ambulatory Care Sensitive Conditions | <0.001 | (0.000, 0.000) | 0.871 |
|
| |||
| Total Annual Spending, $ | |||
|
| |||
| Annual Spending ¶ | 7.19 | (−27.55, 41.92) | 0.685 |
Notes: This table shows the estimated association between a provider practice’s price (measured on a continuous basis, relative to the Primary Care Service Area mean) and patient experiences with care, the receipt of preventive services, acute care visits, and health care spending. The analysis is limited to provider practices with above average prices in their PCSAs, and to PCSAs with five or more practices with above-average prices.
Estimates are adjusted for geography at the level of counties and for all patient-level characteristics in Exhibit 1 of the main manuscript except for self-rated general health, self-rated mental health, and functional limitations. All estimates are also adjusted for CAHPS survey weights.
Among patients ≥ 65 years old.
Among patients with a diagnosis of diabetes by the beginning of 2011 based on the Medicare Chronic Conditions Data Warehouse.
Among women 65–69 years old.
Includes all fee-for-service Medicare spending except for rehabilitation facility and long-term acute care facility spending.
Appendix Exhibit 6.
Adjusted differences in patient experiences, use of preventive services, use of acute care, and total Medicare spending between patients served by high-priced versus low-priced practice (within counties instead of within PCSAs)
| Outcome | Adjusted Difference High-Low Priced Practices† | 95% Confidence Interval | P-value |
|---|---|---|---|
| Experiences with Care | |||
|
| |||
| Overall Ratings of Care and Physicians | |||
| Rating of health care | 0.035 | (0.003, 0.066) | 0.031 |
| Rating of primary physician | 0.020 | (−0.007, 0.048) | 0.147 |
| Rating of specialist | 0.005 | (−0.031, 0.040) | 0.791 |
| Timely Access to Care | |||
| Timely access to care (3-item composite) | −0.017 | (−0.056, 0.023) | 0.412 |
| Waiting time in the office | 0.198 | (0.137, 0.258) | <.0001 |
| Interactions with Primary Physician | |||
| Physician interaction (4-item composite) | −0.009 | (−0.040, 0.022) | 0.570 |
| Care Coordination and Management | |||
| Primary physician informed about specialty care | 0.079 | (0.009, 0.149) | 0.028 |
| Patient care information available to primary physician | −0.011 | (−0.037, 0.014) | 0.370 |
| Medication review | 0.113 | (0.059, 0.167) | <.0001 |
| Patients’ access to visit notes | 0.082 | (0.073, 0.091) | <.0001 |
| Care management from physician’s practice | 0.023 | (−0.092, 0.139) | 0.692 |
| Communication of test results (2-item composite) | 0.065 | (0.015, 0.116) | 0.012 |
|
| |||
| Use of Preventive Services, % within timeframe | |||
|
| |||
| Influenza vaccine in last 1 year | 1.86 | (1.11, 2.60) | <.0001 |
| Pneumococcal vaccine (ever) ‡ | 3.63 | (2.83, 4.43) | <.0001 |
| Preventive services for diabetics ˆ | |||
| Glycated hemoglobin testing in last 1 year | 0.39 | (−1.02, 1.80) | 0.589 |
| Low-density lipoprotein testing in last 1 year | 0.04 | (−1.20, 1.27) | 0.956 |
| Diabetic retinal examination in last 2 years | 1.75 | (0.41, 3.09) | 0.011 |
| Breast Cancer Screening in last 2 years § | 2.09 | (−0.14, 4.31) | 0.066 |
|
| |||
| Acute Care Use, No. Per Year | |||
|
| |||
| Emergency department visits not related to inpatient admissions | 0.004 | (−0.015, 0.023) | 0.683 |
| Acute hospitalizations | 0.006 | (−0.003, 0.016) | 0.207 |
| Hospitalizations for Ambulatory Care Sensitive Conditions | 0.001 | (−0.003, 0.005) | 0.728 |
|
| |||
| Total Annual Spending, $ | |||
|
| |||
| Annual Spending ¶ | 24.14 | (−208.74, 257.02) | 0.839 |
Notes: This table shows the estimated association between visiting a provider practice with a high vs. a below-average price in a county and patients’ experiences with care, receipt of preventive services, acute care visits, and health care spending.
Estimates are adjusted for geography at the level of counties and for all patient-level characteristics in Exhibit 1 of the main manuscript except for self-rated general health, self-rated mental health, and functional limitations. All estimates are also adjusted for CAHPS survey weights.
Among patients ≥ 65 years old.
Among patients with a diagnosis of diabetes by the beginning of 2011 based on the Medicare Chronic Conditions Data Warehouse.
Among women 65–69 years old.
Includes all fee-for-service Medicare spending except for rehabilitation facility and long-term acute care facility spending.
Appendix Exhibit 7.
Results of main analysis without adjustment for patient characteristics
| Outcome | Adjusted Difference † | 95% Confidence Interval | P-value |
|---|---|---|---|
| Experiences with Care | |||
|
| |||
| Overall Ratings of Care and Physicians | |||
| Rating of health care | 0.009 | (−0.039, 0.056) | 0.723 |
| Rating of primary physician | 0.009 | (−0.032, 0.050) | 0.662 |
| Rating of specialist | −0.003 | (−0.057, 0.051) | 0.913 |
| Timely Access to Care | |||
| Timely access to care (3-item composite) | 0.013 | (−0.046, 0.072) | 0.669 |
| Waiting time in the office | 0.166 | (0.076, 0.256) | 0.000 |
| Interactions with Primary Physician | |||
| Physician interaction (4-item composite) | 0.028 | (−0.018, 0.075) | 0.233 |
| Care Coordination and Management | |||
| Primary physician informed about specialty care | 0.135 | (0.029, 0.241) | 0.013 |
| Patient care information available to primary physician | 0.013 | (−0.024, 0.050) | 0.494 |
| Medication review | 0.134 | (0.053, 0.216) | 0.001 |
| Patients’ access to visit notes | 0.054 | (0.041, 0.067) | <.0001 |
| Care management from physician’s practice | 0.126 | (−0.063, 0.315) | 0.190 |
| Communication of test results (2-item composite) | 0.091 | (0.014, 0.168) | 0.020 |
|
| |||
| Use of Preventive Services, % within timeframe | |||
|
| |||
| Influenza vaccine in last 1 year | 1.38 | (0.26, 2.51) | 0.016 |
| Pneumococcal vaccine (ever) ‡ | 1.58 | (0.34, 2.81) | 0.012 |
| Preventive services for diabetics ˆ | |||
| Glycated hemoglobin testing in last 1 year | 1.79 | (−0.50, 4.07) | 0.122 |
| Low-density lipoprotein testing in last 1 year | 0.19 | (−1.80, 2.18) | 0.849 |
| Diabetic retinal examination in last 2 years | 0.08 | (−2.16, 2.32) | 0.944 |
| Breast Cancer Screening in last 2 years § | 0.61 | (−3.37, 4.58) | 0.765 |
|
| |||
| Acute Care Use, No. Per Year | |||
|
| |||
| Emergency department visits not related to inpatient admissions | −0.006 | (−0.036, 0.024) | 0.695 |
| Acute hospitalizations | 0.002 | (−0.015, 0.019) | 0.777 |
| Hospitalizations for Ambulatory Care Sensitive Conditions | 0.001 | (−0.005, 0.006) | 0.843 |
|
| |||
| Total Annual Spending, $ | |||
|
| |||
| Annual Spending ¶ | −94.29 | (−570.50, 381.92) | 0.698 |
Notes: This table shows the estimated association between visiting a provider practice with a high vs. a below-average price and patient experiences with care, the receipt of preventive services, acute care visits, and health care spending.
Estimates are adjusted for geography at the level of PCSAs (Primary Care Service Areas), but not for the patient-level characteristics shown in Exhibit 1 of the main manuscript. Estimates are adjusted for CAHPS survey weights.
Among patients ≥ 65 years old.
Among patients with a diagnosis of diabetes by the beginning of 2011 based on the Medicare Chronic Conditions Data Warehouse.
Among women 65–69 years old.
Includes all fee-for-service Medicare spending except for rehabilitation facility and long-term acute care facility spending.
Appendix Exhibit 8.
Results additionally adjusted for self-rated health and functional limitations
| Outcome | Adjusted Difference † | 95% Confidence Interval | P-value |
|---|---|---|---|
| Experiences with Care | |||
|
| |||
| Overall Ratings of Care and Physicians | |||
| Rating of health care | −0.003 | (−0.049, 0.042) | 0.884 |
| Rating of primary physician | 0.006 | (−0.035, 0.046) | 0.789 |
| Rating of specialist | −0.019 | (−0.072, 0.034) | 0.491 |
| Timely Access to Care | |||
| Timely access to care (3-item composite) | 0.001 | (−0.057, 0.060) | 0.963 |
| Waiting time in the office | 0.150 | (0.061, 0.240) | 0.001 |
| Interactions with Primary Physician | |||
| Physician interaction (4-item composite) | 0.021 | (−0.025, 0.066) | 0.371 |
| Care Coordination and Management | |||
| Primary physician informed about specialty care | 0.141 | (0.035, 0.246) | 0.009 |
| Patient care information available to primary physician | 0.009 | (−0.027, 0.046) | 0.626 |
| Medication review | 0.128 | (0.047, 0.209) | 0.002 |
| Patients’ access to visit notes | 0.056 | (0.043, 0.069) | <.0001 |
| Care management from physician’s practice | 0.105 | (−0.083, 0.293) | 0.274 |
| Communication of test results (2-item composite) | 0.082 | (0.005, 0.158) | 0.036 |
|
| |||
| Use of Preventive Services, % within timeframe | |||
|
| |||
| Influenza vaccine in last 1 year | 1.49 | (0.39, 2.59) | 0.008 |
| Pneumococcal vaccine (ever) ‡ | 1.76 | (0.57, 2.95) | 0.004 |
| Preventive services for diabetics ˆ | |||
| Glycated hemoglobin testing in last 1 year | 1.40 | (−0.80, 3.60) | 0.214 |
| Low-density lipoprotein testing in last 1 year | 0.08 | (−1.86, 2.03) | 0.932 |
| Diabetic retinal examination in last 2 years | 0.19 | (−1.90, 2.30) | 0.861 |
| Breast Cancer Screening in last 2 years § | 0.11 | (−3.77, 4.00) | 0.954 |
|
| |||
| Acute Care Use, No. Per Year | |||
|
| |||
| Emergency department visits not related to inpatient admissions | 0.008 | (−0.019, 0.035) | 0.556 |
| Acute hospitalizations | 0.009 | (−0.004, 0.023) | 0.184 |
| Hospitalizations for Ambulatory Care Sensitive Conditions | 0.002 | (−0.002, 0.008) | 0.413 |
|
| |||
| Total Annual Spending, $ | |||
|
| |||
| Annual Spending ¶ | 115.28 | (−238.00, 468.55) | 0.523 |
Notes: This table shows the estimated association between visiting a practice with a high vs. a below-average price and patient experiences with care, the receipt of preventive services, acute care visits, and health care spending.
Estimates are adjusted for geography at the level of PCSAs (Primary Care Service Areas) and for all patient-level characteristics in Exhibit 1 of the main manuscript. All estimates are also adjusted for CAHPS survey weights.
Among patients ≥ 65 years old.
Among patients with a diagnosis of diabetes by the beginning of 201 based on the Medicare Chronic Conditions Data Warehouse.
Among women 65–69 years old.
Includes all fee-for-service Medicare spending except for rehabilitation facility and long-term acute care facility spending.
IX. Analyses for Large versus Small Practices
Here, we present our results comparing large versus small practices within Primary Care Service Areas (PCSAs). As in our main analyses that compared high-priced versus low-priced practices, we attributed fee-for-service Medicare patients meeting our inclusion criteria to practices on the basis of their 2012 primary care claims. Practices were defined using Taxpayer Identification Numbers (TINs). To measure practice size, we used FAIR Health claims to identify the number of unique clinicians (identified by NPIs) that billed the plurality of services with CPTs 99201-99215 to a TIN in 2013. We then categorized practices as large versus small, relative to the average practice (TIN) size in a PCSA. PCSAs contributing fewer than two differently sized practices with attributed CAHPS respondents were not included in our analyses.
Appendix Exhibit 9, on the following page, shows the characteristics of patients attributed to large versus small practices. Large practices had an average of approximately 155 clinicians, as compared to a mean of 10 clinicians for small practices. Consistent with data presented in the main manuscript, large practices also commanded higher prices on average (an average of $81.09 for large practices versus $67.55 for smaller practices, equivalent to a $13.50 price differential for CPT 99213). As the remainder of the table demonstrates, the patients of large providers were generally similar to the patients of smaller providers within the same PCSAs.
In regression-adjusted comparisons of large versus small practices, we found that the patients of large practices reported better experiences with care on 3 measures of care coordination and management (primary doctor informed about specialty care, medication review, and access to visit notes), and were slightly more likely to have had influenza and pneumococcal vaccinations (Appendix Exhibit 10). We found no differences between large and small practices in their Medicare patients’ use of preventive services for diabetes, breast cancer screening, hospitalizations, or total Medicare spending. These findings are consistent with our comparisons of high price versus low price providers. However, the point estimates are somewhat smaller in magnitude, compared with our comparison of practices on the basis of price. This may reflect the fact provider size is imprecisely measured (we observed commercial claims for only a portion of TIN’s patient panel) and may not capture other attributes of practice capability that are conveyed in price. On the other hand, we found that patients of larger provider groups were less likely to get test results and reported marginally lower overall ratings of care between high-priced and low-priced providers.
Appendix Exhibit 9.
Characteristics of CAHPS Respondents Attributed to Large versus Small Practices within Primary Care Service Areas
| Large Practices (n=2,858) |
Small Practices (n=8,246) |
P-value† | |
|---|---|---|---|
| Number of patients | 15,527 | 15,413 | – |
| TIN Size ‡ | 154.7 | 10.5 | <0.001 |
| Mean Price of CPT 99213 ($) | $81.09 | $67.55 | <0.001 |
|
| |||
| Patient Characteristics: | |||
| Age (years) | 74.1 | 74.4 | 0.03 |
| Female (%) | 59.1 | 59.0 | 0.87 |
| Race/Ethnicity (%) | |||
| White | 82.6 | 82.1 | 0.59 |
| Black | 5.4 | 5.8 | |
| Hispanic | 3.6 | 3.7 | |
| Other | 8.3 | 8.4 | |
| Education (%) | |||
| Less than High School | 14.2 | 14.8 | 0.09 |
| High School | 34.2 | 35.0 | |
| Some College | 25.5 | 25.8 | |
| College Graduate | 11.3 | 10.6 | |
| Graduate Education | 14.8 | 13.8 | |
| Supplemental and Prescription Drug Insurance (%) | 86.1 | 85.9 | 0.70 |
| Medigap | 24.0 | 23.8 | 0.66 |
| Employer-sponsored | 27.0 | 27.3 | 0.56 |
| TRICARE/Veterans’ Administration | 10.9 | 10.2 | 0.11 |
| Other | 12.8 | 13.9 | 0.02 |
| Prescription drug coverage | 38.4 | 38.0 | 0.56 |
| Medicaid recipient (%) | 11.7 | 11.7 | 0.86 |
| Disabled (%) | 16.2 | 15.2 | 0.04 |
| Smoker (%) | 9.4 | 9.9 | 0.19 |
| Required help to complete CAHPS survey (%) | 9.3 | 9.5 | 0.62 |
| Lives alone (%) | 34.1 | 34.1 | 0.99 |
| End-stage renal disease (%) | 0.6 | 0.7 | 0.47 |
| Number of chronic conditions | 6.33 | 6.43 | 0.03 |
| Hierarchical Condition Categories (HCC) score | 1.27 | 1.27 | 0.97 |
| Difficulty with ≥1 activity of daily living (%) | 38.4 | 37.4 | 0.14 |
| Self-Rated General Health (%) | |||
| Poor | 7.0 | 6.7 | 0.13 |
| Fair | 22.0 | 21.8 | |
| Good | 36.6 | 35.7 | |
| Very Good | 25.3 | 26.3 | |
| Excellent | 6.6 | 7.2 | |
| Self-Rated Mental Health (%) | |||
| Poor | 2.9 | 2.8 | 0.83 |
| Fair | 11.8 | 12.0 | |
| Good | 28.5 | 28.6 | |
| Very Good | 31.9 | 31.6 | |
| Excellent | 21.7 | 22.2 | |
P-value for the difference in means or proportions of patients with a given characteristic attributed to high-price vs. low-price practices, adjusted for geography at the PCSA level.
Number of clinicians billing under the TIN.
Source: Authors’ calculations from the CAHPS survey linked to commercial insurer prices from FAIR Health.
Appendix Exhibit 10.
Adjusted differences in patient experiences, use of preventive services, use of acute care, and total Medicare spending between patients served by large versus small practices
| Outcome | Adjusted Difference Large – Small Practices† | 95% Confidence Interval | P-value |
|---|---|---|---|
| Experiences with Care | |||
|
| |||
| Overall Ratings of Care and Physicians | |||
| Rating of health care | −0.045 | (−0.091, 0.002) | 0.062 |
| Rating of primary physician | −0.004 | (−0.045, 0.037) | 0.846 |
| Rating of specialist | −0.019 | (−0.073, 0.035) | 0.493 |
| Timely Access to Care | |||
| Timely access to care (3-item composite) | −0.053 | (−0.112, 0.007) | 0.082 |
| Waiting time in the office | 0.018 | (−0.073, 0.109) | 0.699 |
| Interactions with Primary Physician | |||
| Physician interaction (4-item composite) | −0.014 | (−0.060, 0.033) | 0.567 |
| Care Coordination and Management | |||
| Primary physician informed about specialty care | 0.100 | (−0.009, 0.208) | 0.072 |
| Patient care information available to primary physician | 0.002 | (−0.035, 0.039) | 0.919 |
| Medication review | 0.127 | (0.046, 0.208) | 0.002 |
| Patients’ access to visit notes | 0.083 | (0.069, 0.096) | <.0001 |
| Care management from physician’s practice | 0.088 | (−0.097, 0.272) | 0.353 |
| Communication of test results (2-item composite) | −0.037 | (−0.114, 0.040) | 0.349 |
|
| |||
| Use of Preventive Services, % within timeframe | |||
|
| |||
| Influenza vaccine in last 1 year | 1.55 | (0.45, 2.65) | 0.006 |
| Pneumococcal vaccine (ever) ‡ | 3.29 | (2.11, 4.47) | <.0001 |
| Preventive services for diabetics ˆ | |||
| Glycated hemoglobin testing in last 1 year | 1.07 | (−1.13, 3.27) | 0.342 |
| Low-density lipoprotein testing in last 1 year | 0.46 | (−1.52, 2.45) | 0.648 |
| Diabetic retinal examination in last 2 years | 1.49 | (−0.60, 3.58) | 0.162 |
| Breast Cancer Screening in last 2 years § | 1.61 | (−2.29, 5.51) | 0.419 |
|
| |||
| Acute Care Use, No. Per Year | |||
|
| |||
| Emergency department visits not related to inpatient admissions | −0.007 | (−0.034, 0.021) | 0.630 |
| Acute hospitalizations | 0.001 | (−0.013, 0.015) | 0.889 |
| Hospitalizations for Ambulatory Care Sensitive Conditions | 0.000 | (−0.005, 0.006) | 0.963 |
|
| |||
| Total Annual Spending, $ | |||
|
| |||
| Annual Spending ¶ | −170.21 | (−526.00, 186.00) | 0.349 |
Notes: This table shows the estimated association between visiting a practice with a high vs. a below-average price and patient experiences with care, the receipt of preventive services, acute care visits, and health care spending.
Estimates are adjusted for geography at the level of PCSAs (Primary Care Service Areas) and for all patient-level characteristics in Exhibit 1 of the main manuscript. All estimates are also adjusted for CAHPS survey weights.
Among patients ≥ 65 years old.
Among patients with a diagnosis of diabetes by the beginning of 201 based on the Medicare Chronic Conditions Data Warehouse.
Among women 65–69 years old.
Includes all fee-for-service Medicare spending except for rehabilitation facility and long-term acute care facility spending.
Footnotes
Source: Federal Register, Vol. 76 No. 212 (2011). Department of Health and Human Services Rules and Regulations, pp. 67821-67822. Centers for Medicare and Medicaid Services, Summary of Physician Value-based Payment Modifier Policies. Accessed May 13, 2016 via https://www.cms.gov/Medicare/Medicare-Fee-for-Service-Payment/PhysicianFeedbackProgram/Downloads/CY2015ValueModifierPolicies.pdf.
Due to the sparse number of TINs in certain PCSAs, standard errors were estimated without clustering; however, in robustness checks, we verified that clustering did not materially change our inferences in the subset of PCSAs containing ≥5 TINs, for which it was feasible to compute clustered standard errors (results not shown).
Notes
- 1.Cooper Z, Craig S, Gaynor M, Van Reenan J. (National Bureau of Economic Research Working Paper Series).The Price Ain’t Right? Hospital Prices and Health Spending on the Privately Insured. 2015;(21815) doi: 10.1093/qje/qjy020. [DOI] [PMC free article] [PubMed] [Google Scholar]
- 2.Ginsburg PB. High and rising health care costs: Demistifying U.S. health care spending: Robert Wood Johnson Foundation. 2008 Oct; 2008. [Google Scholar]
- 3.Gaynor M, Town R. The impact of hospital consolidation—Update. Robert Wood Johnson Foundation; 2012. Jun, 2012. [Google Scholar]
- 4.Baker LC, Bundorf MK, Royalty AB, Levin Z. Physician practice competition and prices paid by private insurers for office visits. Jama. 2014;312:1653–62. doi: 10.1001/jama.2014.10921. [DOI] [PubMed] [Google Scholar]
- 5.Baker LC, Bundorf MK, Kessler DP. Vertical Integration: Hospital Ownership Of Physician Practices Is Associated With Higher Prices And Spending. Health Aff (Millwood) 2014;33:756–63. doi: 10.1377/hlthaff.2013.1279. [DOI] [PubMed] [Google Scholar]
- 6.Neprash HT, Chernew ME, Hicks AL, Gibson T, McWilliams JM. Association of Financial Integration between Physicians and Hospitals and Commercial Health Care Prices. JAMA Intern Med. 2015 doi: 10.1001/jamainternmed.2015.4610. [DOI] [PubMed] [Google Scholar]
- 7.Arrow KJ. Uncertainty and the Welfare Economics of Medical Care. Am Econ Rev. 1963;53:941–73. [Google Scholar]
- 8.Gaynor M. (National Bureau of Economic Research Working Paper Series).What Do We Know About Competition and Quality in Health Care Markets? 2006;(12301) [Google Scholar]
- 9.Davis KL. Hospital Mergers Can Lower Costs and Improve Medical Care. Wall Street Journal. 2014 Sep 15; 2014. [Google Scholar]
- 10.The Value of Provider Integration. American Hospital Association; 2014. Mar, 2014. [Google Scholar]
- 11.Hussey PS, Wertheimer S, Mehrotra A. The Association Between Health Care Quality and Cost: A Systematic Review. Ann Intern Med. 2013;158:27–34. doi: 10.7326/0003-4819-158-1-201301010-00006. [DOI] [PMC free article] [PubMed] [Google Scholar]
- 12.White C, Reschovsky JD, Bond AM. Understanding Differences Between High- And Low-Price Hospitals: Implications For Efforts To Rein In Costs. Health Aff (Millwood) 2014;33:324–31. doi: 10.1377/hlthaff.2013.0747. [DOI] [PubMed] [Google Scholar]
- 13.Casalino LP, Pesko MF, Ryan AM, et al. Small Primary Care Physician Practices Have Low Rates Of Preventable Hospital Admissions. Health Aff (Millwood) 2014;33:1680–8. doi: 10.1377/hlthaff.2014.0434. [DOI] [PubMed] [Google Scholar]
- 14.Crespin DJ, Christianson JB, McCullough JS, Finch MD. Health System Consolidation and Diabetes Care Performance at Ambulatory Clinics. Health Serv Res. 2016;51:1772–95. doi: 10.1111/1475-6773.12450. [DOI] [PMC free article] [PubMed] [Google Scholar]
- 15.McWilliams J, Chernew ME, Zaslavsky AM, Hamed P, Landon BE. DElivery system integration and health care spending and quality for medicare beneficiaries. JAMA Intern Med. 2013;173:1447–56. doi: 10.1001/jamainternmed.2013.6886. [DOI] [PMC free article] [PubMed] [Google Scholar]
- 16.Scott KW, Orav E, Cutler DM, Jha AK. Changes in hospital–physician affiliations in u.s. hospitals and their effect on quality of care. Ann Intern Med. 2016 doi: 10.7326/M16-0125. [DOI] [PubMed] [Google Scholar]
- 17.McWilliams JM, Landon BE, Chernew ME, Zaslavsky AM. Changes in patients’ experiences in Medicare Accountable Care Organizations. N Engl J Med. 2014;371:1715–24. doi: 10.1056/NEJMsa1406552. [DOI] [PMC free article] [PubMed] [Google Scholar]
- 18.EDITOR please insert appendix verbiage here.
- 19.McWilliams J, Chernew ME, Dalton JB, Landon BE. Outpatient care patterns and organizational accountability in medicare. JAMA Intern Med. 2014;174:938–45. doi: 10.1001/jamainternmed.2014.1073. [DOI] [PubMed] [Google Scholar]
- 20.FAIR Health. (Accessed November 17, 2015, 2015, at http://www.fairhealth.org/About-FH)
- 21.Goodman DC, Mick SS, Bott D, et al. Primary care service areas: a new tool for the evaluation of primary care services. Health Serv Res. 2003;38:287–309. doi: 10.1111/1475-6773.00116. [DOI] [PMC free article] [PubMed] [Google Scholar]
- 22.McWilliams JM, Hatfield LA, Chernew ME, Landon BE, Schwartz AL. Early Performance of Accountable Care Organizations in Medicare. New England Journal of Medicine. 2016;374:2347–66. doi: 10.1056/NEJMsa1600142. [DOI] [PMC free article] [PubMed] [Google Scholar]
- 23.Neprash HT, Wallace J, Chernew ME, McWilliams JM. Measuring Prices in Health Care Markets Using Commercial Claims Data. Health Serv Res. 2015;50:2037–47. doi: 10.1111/1475-6773.12304. [DOI] [PMC free article] [PubMed] [Google Scholar]
- 24.Clemens J, Gottlieb JD. (National Bureau of Economic Research Working Paper Series).In the Shadow of a Giant: Medicare’s Influence on Private Physician Payments. 2013;(19503) [Google Scholar]
- 25.Roberts ET, Chernew ME, McWilliams JM. New Evidence of Provider and Insurer Bargaining Power in Multi-Payer Commercial Claims Data. Health Aff (Millwood) 2016 In Press. [Google Scholar]
- 26.Kuye IO, Frank RG, McWilliams JM. Cognition and take-up of subsidized drug benefits by Medicare beneficiaries. JAMA Intern Med. 2013;173:1100–7. doi: 10.1001/jamainternmed.2013.845. [DOI] [PMC free article] [PubMed] [Google Scholar]
- 27.Physician Compare Datasets. (Accessed May 15, 2016, 2016, at https://data.medicare.gov/data/physician-compare)
- 28.McWilliams JM, Landon BE, Chernew ME. Changes in health care spending and quality for Medicare beneficiaries associated with a commercial ACO contract. Jama. 2013;310:829–36. doi: 10.1001/jama.2013.276302. [DOI] [PMC free article] [PubMed] [Google Scholar]
- 29.Baicker K, Chernew ME, Robbins JA. The spillover effects of Medicare managed care: Medicare Advantage and hospital utilization. Journal of Health Economics. 2013;32:1289–300. doi: 10.1016/j.jhealeco.2013.09.005. [DOI] [PMC free article] [PubMed] [Google Scholar]
- 30.Rittenhouse DR, Casalino LP, Shortell SM, et al. Small and medium-size physician practices use few patient-centered medical home processes. Health Aff (Millwood) 2011;30:1575–84. doi: 10.1377/hlthaff.2010.1210. [DOI] [PubMed] [Google Scholar]
- 31.Rittenhouse DR, Shortell SM, Gillies RR, et al. Improving chronic illness care: findings from a national study of care management processes in large physician practices. Med Care Res Rev. 2010;67:301–20. doi: 10.1177/1077558709353324. [DOI] [PubMed] [Google Scholar]
- 32.Burns LR, Goldsmith JC, Sen A. Horizontal and Vertical Integration of Physicians: A Tale of Two Tails. Advances in Health Care Management. 2013;15:39–117. doi: 10.1108/s1474-8231(2013)0000015009. [DOI] [PubMed] [Google Scholar]
- 33.McWilliams JM, Chernew ME, Landon BE, Schwartz AL. Performance Differences in Year 1 of Pioneer Accountable Care Organizations. New England Journal of Medicine. 2015;372:1927–36. doi: 10.1056/NEJMsa1414929. [DOI] [PMC free article] [PubMed] [Google Scholar]
- 34.McWilliams JM. Changes in Medicare Shared Savings Program Savings from 2013 to 2014. JAMA. 2016 doi: 10.1001/jama.2016.12049. published online. [DOI] [PMC free article] [PubMed] [Google Scholar]