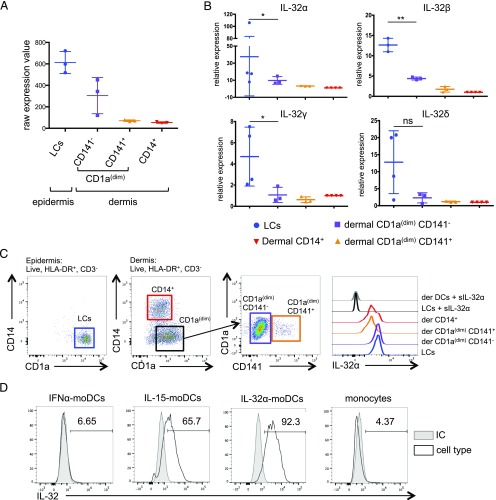
FIGURE 1.
Expression of IL-32 in steady state DCs. (A) Raw expression value of IL32 gene expression from microarray data (31) (Gene Expression Omnibus accession no. GSE66355; https://www.ncbi.nlm.nih.gov/geo/query/acc.cgi?acc=GSE66355). Each dot represents a single donor (n = 3). (B) IL-32 isoforms α, β, γ, and δ expression was determined in sorted skin DCs by quantitative RT-PCR relative to the CD14+ dermal DCs. Each dot represents a single donor (n = 3–4). Values are calculated as average ± SD. *p ≤ 0.05, **p ≤ 0.01. (C) Left, Dot plots represent the gating strategy for epidermal and dermal DC subset. Right, IL-32α expression in skin DC subsets was assessed by flow cytometry. IL-32α was stained in the presence of an excess molar concentration of soluble IL-32α (1 μg/ml). Histograms show one representative experiment of three. (D) IL-32 expression in IFN-α moDCs, IL-15 moDCs, IL-32α moDCs, and monocytes was analyzed by flow cytometry. Histograms show IL-32 (all isoforms) expression (black line) or isotype control (IC; gray filled histogram). One representative experiment of three is shown.

