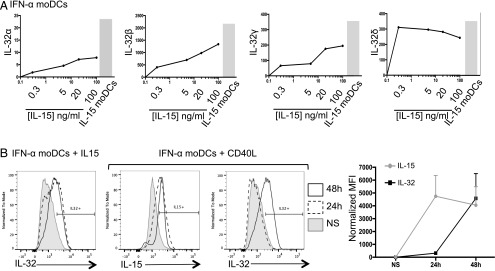
FIGURE 2.
IL-15 is a potent inducer of IL-32. (A) IFN-α moDCs were stimulated with different concentrations of IL-15 (0.3, 5, 20, or 100 ng/ml) for 6 h or not stimulated. IL-32 isoform expression was assessed by quantitative RT-PCR. Graphs show the expression level of IL-32α, IL-32β, IL-32γ, and IL-32δ (left to right) relative to unstimulated DCs. The gray bar chart represents the corresponding IL-32 isoform expression at steady state in IL-15 moDCs. One representative experiment of three is shown. (B) IFN-α moDCs were stimulated with IL-15 (1 ng/ml) or CD40L (200 ng/ml) for 24 h (dashed line) or 48 h (black line) or NS (gray filled histogram). Intracellular production of IL-32 and IL-15 was assessed by flow cytometry. One representative experiment of three performed is shown. Far right, Graph shows IL-32 (black) and IL-15 (gray) expression by moDCs at 24 or 48 h following stimulation with CD40L; n = 3.

