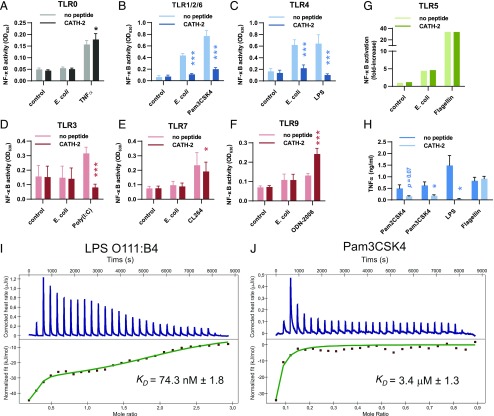
FIGURE 4.
Inhibition of E. coli–induced TLR2 and TLR4 activation by CATH-2. (A–F) HEK-TLR cells overexpressing no TLR (TLR0), TLR1, 2, and 6 (TLR1/2/6), TLR3, TLR4, TLR7, or TLR9, as well as a SEAP reporter gene, were stimulated with 5 × 10⁴ CFU/ml heat-killed E. coli O78 or TNF-α (50 ng/ml), Pam3CSK4 (5 ng/ml), LPS (0.5 ng/ml), Poly(I:C) (250 ng/ml), CL264 (250 ng/ml), or ODN-2006 (50 nM) in the presence or absence of 5 μM CATH-2. After 18 h, the supernatant was used to determine NF-κB activation through QUANTI-Blue analysis (n ≥ 3). Error bars show SEM. *p < 0.05, ***p < 0.001, two-way repeated-measures ANOVA with Bonferroni post hoc test. (G) HEK–TLR5–luciferase cells were stimulated with 5 × 10⁴ CFU/ml heat-killed E. coli O78 or flagellin (10 ng/ml) in the presence or absence of 5 μM CATH-2. NF-κB activation was determined after 6 h by analyzing luciferase activity by Bright-Glo. Results are representative of three independent experiments. (H) J774.A1 cells were stimulated with Pam2CSK4 (10 pg/ml), Pam3CSK4 (10 ng/ml), LPS (10 ng/ml), or flagellin (1 μg/ml) in the presence or absence of 5 μM CATH-2 for 2 h, after which TNF-α secretion was determined by ELISA (n ≥ 3). Error bars show SEM. *p < 0.05, paired t test. Analysis of ITC titration of CATH-2 into LPS O111:B4 (I) or Pam3CSK4 (J) solution. Images are representative for n = 2. The KD value shown is the mean calculated KD for n = 2 ± SEM.

