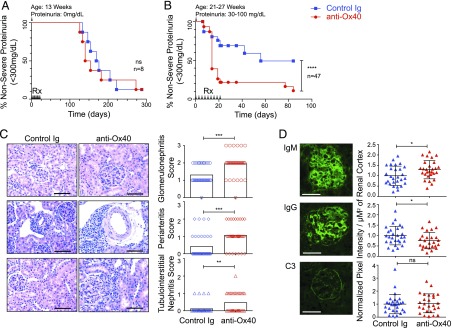
FIGURE 2.
Anti-Ox40 agonist mAb treatment exacerbates renal disease and IgM deposition in NZB/W F1 mice. Renal disease monitoring following anti-Ox40 agonist mAb (red) and a control Ig (blue) treatment (10 mg/kg, three times per week for 3 wk) in NZB/W F1 mice. Black arrows (Rx) refer to treatment days. The age and proteinuria status of each cohort (at the time of first treatment) is indicated at the top of each plot. (A) Thirteen-week-old proteinuria-free NZB/W F1 mice at treatment start. (B) Three independent cohorts (21-, 26-, and 27-wk-old) of NZB/W F1 mice with proteinuria 30–100 mg/dl at treatment start. (C) Representative H&E- and PAS-stained kidney sections (left and middle panels) highlighting glomeruli (top panels), periarterial regions (middle panels), and tubulointerstitium (bottom panels). Scale bars, 100 μm. Corresponding disease severity scores (right panels). Group means are plotted in black (n = 36 per group combined). (D) Representative images from frozen kidney sections (left panels) stained for glomerular deposits of IgM (top panel), IgG (middle panel), and C3 (bottom panel). Scale bars, 50 μm. Corresponding signal intensity in the cortex regions is presented as pixel intensity/μM2 of cortex with group mean ± SD from two independent cohorts (n = 25–28 per group, combined) (right panels). *p < 0.05, **p < 0.01, ***p < 0.001, ****p < 0.0001.

