FIGURE 5.
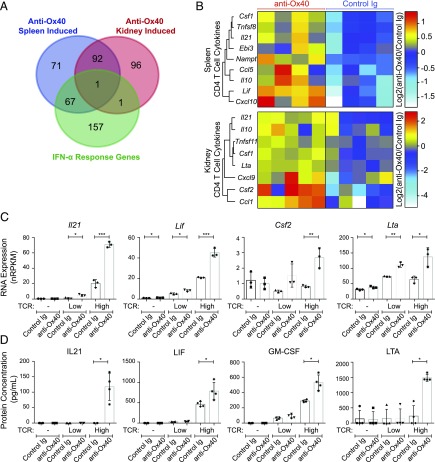
Gene expression and cytokine production changes in Ox40-stimulated CD4 T cells. (A and B) RNA was collected from sorted live CD45+CD19−CD3+CD4+ T cells from the spleen (n = 4) and kidney (n = 5) of 21–27-wk-old NZB/W F1 mice with 30–100 mg/dl proteinuria (at the start of treatment) after 1 wk (day 8) of anti-Ox40 agonist mAb treatment, followed by RNASeq analysis. (A) Venn diagram showing the overlap of gene-expression changes from anti-Ox40 mAb treatment in the spleen and kidney, with a splenic CD4 T cell IFN-α response gene dataset (43). (B) Heat map euclidean clustering of genes with the cytokine classification (IPA) induced (p < 0.05, nRPKM > 2, and fold-change > 1.5) following anti-Ox40 mAb treatment in spleen (upper panel) or kidney (lower panel) CD4 T cells. (C and D) Cultured CD4 T cells from the spleen of 21–27-wk-old NZB/W F1 mice with 30–100 mg/dl proteinuria (as in the in vivo treatments). Cells were cultured with a 0 (-), 1:10 (Low), or 1:1 (High) ratio of TCR-stimulating anti-CD3/CD28 beads with anti-Ox40 mAb or control Ig treatment for 48 h, followed by RNASeq on the cells and supernatant protein analysis. Cytokine genes were selected based on identification in (B) and protein concentrations were measured for the strongest induced genes (by RNA). RNA expression (nRPKM) (C) and supernatant protein concentration (pg/ml) (D) presented as mean ± SD combined from at least two independent experiments. *p < 0.05, **p < 0.01, ***p < 0.001.

