Figure 1.
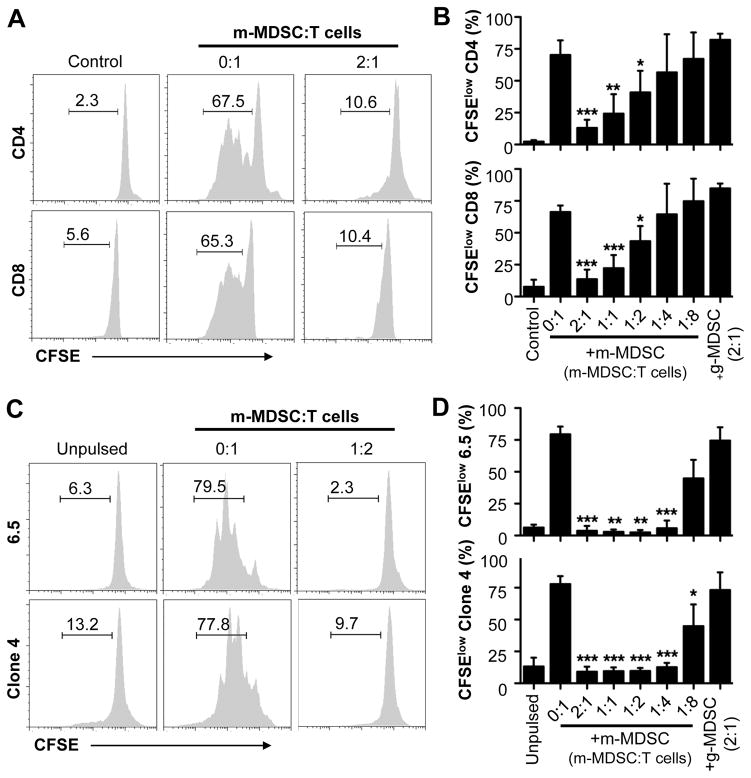
m-MDSCs suppress T cell proliferation in vitro. (A–B) m-MDSCs purified from peritoneal exudates of VV-infected mice were cultured with purified naïve CD4+ (CD4) or CD8+ (CD8) T cells labeled with CFSE at different m-MDSCs to T cell ratios (m-MDSC:T cells), in the presence of 1 μg/ml of anti-CD3 and anti-CD28 antibodies. Some T cells were incubated with medium only (Control). Some T cells were incubated with g-MDSCs at g-MDSC:T cell ratio of 2:1. T cell proliferation was determined 72 h later. (A) FACS plots showing the percentage of CFSElow cells representing proliferating T cells. (B) The mean percentages ± SD of CFSElow cells among total CD4+ or CD8+ T cells are shown (n = 4). (C–D) m-MDSCs were cultured with CFSE-labeled naïve HA-specific CD4+ (6.5) or CD8+ (Clone 4) T cells at different m-MDSCs to T cell ratios (m-MDSC:Tcells), in the presence of class I or class II HA peptide-pulsed CD11c+ DCs. Some 6.5 and Cone 4 T cells were incubated with unpulsed CD11c+ DCs (Unpulsed). Some T cells were incubated with g-MDSCs at g-MDSC:T cell ratio of 2:1. Proliferation was assessed 72 h later. (C) FACS plots showing the percentage of CFSElow cells. (D) The mean percentages ± SD of CFSElow cells among total 6.5 or Clone 4 T cells are shown (n = 3). Asterisks indicate the p value (unpaired student t-test) compared to the 0:1 ratio: * = p <0.05; ** = p <0.01; *** = p <0.001. Data is representative of three independent experiments.

