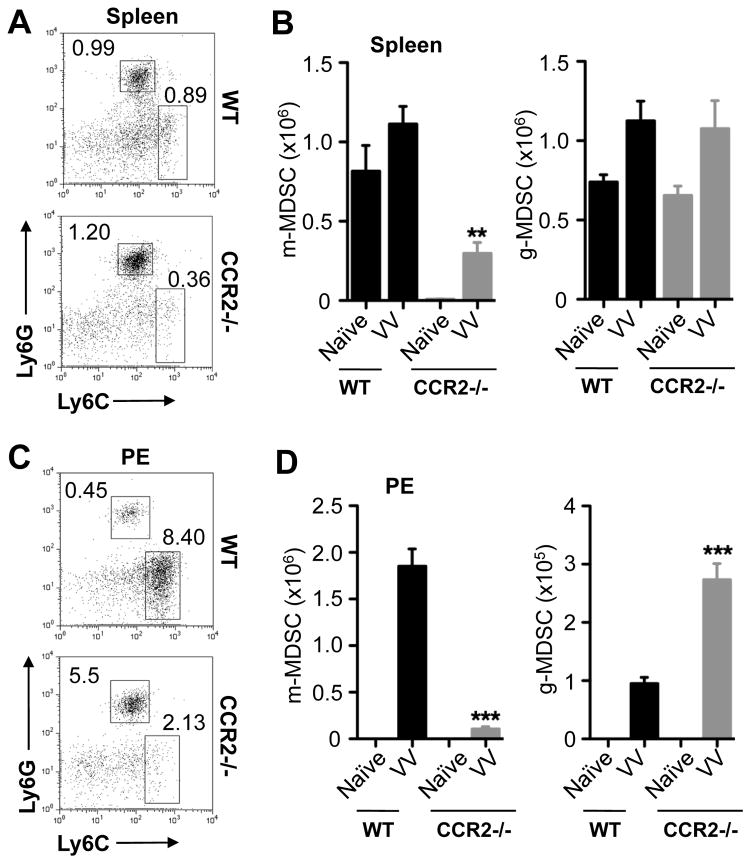
Figure 2.
Impaired migration of m-MDSCs to the site of VV infection in CCR2−/− mice. WT and CCR2−/− mice were infected with 2 × 10⁶ PFU of VV intraperitoneally, or left uninfected (Naïve). 7 days later, cells from spleen (A & B) and peritoneal cavity exudates (PE, C & D) were stained with anti-CD11b, anti-Ly6G and anti-Ly6C. (A & C) FACS plots showing the percentage of m-MDSCs (Ly6ChiLy6G−) and g-MDSCs (Ly6CloLy6G+) among CD11b+ cells. (B & D) The mean cell number ± SD of m-MDSCs or g-MDSCs among total cells is shown (n = 5). Asterisks indicate the p value (unpaired student t-test) compared to the VV-infected WT group: ** = p <0.01; *** = p <0.001. Data is representative of three independent experiments.

