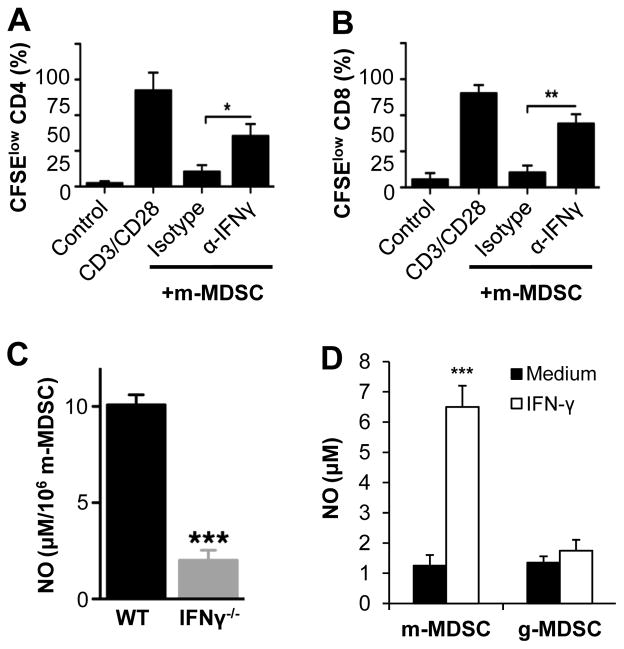
Figure 7.
IFN-γ is required for the activation of m-MDSCs. (A–B) Purified naïve CD4+ (A) or CD8+ (B) T cells were labeled with CFSE and co-cultured at a 2:1 m-MDSC to T cell ratio (+m-MDSC) with purified m-MDSC, in the presence of 1 μg/ml of anti-CD3 and anti-CD28 antibodies (CD3/CD28). Some CD4 and CD8 cells were incubated with media only (Control). Where indicated, 10 μg/ml of a blocking anti-IFN-γ (α-IFNγ), or an isotype control (Isotype), was added to the culture. T cell proliferation was determined 72 h later. The mean percentages ± SD of CFSElow cells among total CD4 or CD8 T cells are shown (n = 3). Asterisks indicate the p value (unpaired student t-test) compared to the isotype control group to show rescue of proliferation: * = p <0.05; ** = p <0.01. (C) WT and IFN-γ−/− mice were infected with 2 × 10⁶ PFU of VV intraperitoneally. 3 days later, m-MDSCs were purified from peritoneal cavity exudates and incubated in medium for 24 h before determining NO production with Griess’ reagent. The mean NO production ± SD by m-MDSCs is shown. The asterisk indicates the p value compared to WT group: *** = p <0.01. (D) m-MDSCs or g-MDSCs harvested bone marrow of naïve mice were cultured in the presence of IFN-γ (40 U/ml) for 24 h and assayed for the production of NO. The mean NO production ± SD is shown. The asterisk indicates the p value (unpaired student t-test) compared to the medium control: *** = p <0.01. Data is representative of three independent experiments.

