
Fig. 6. Histological score for the evaluation of osteochondral repair.
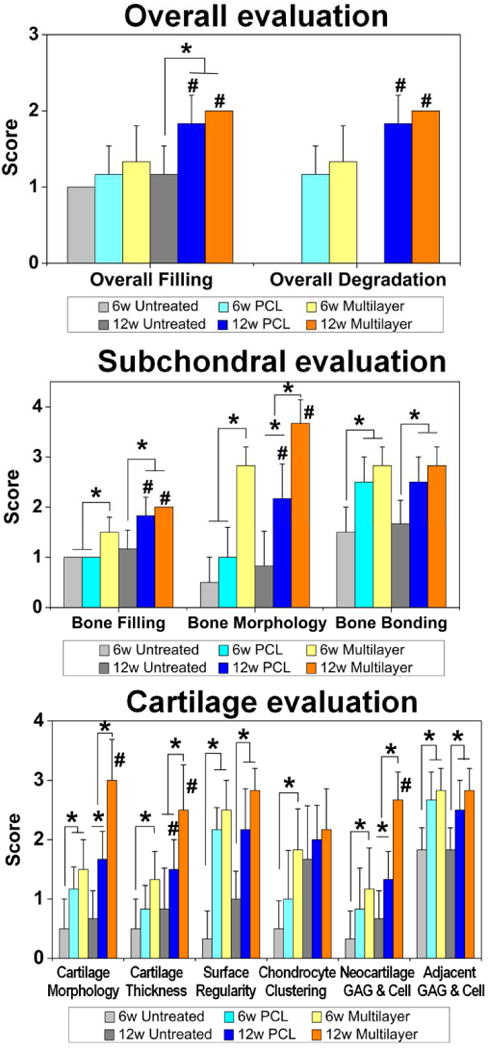
The data showed that the overall tissue filling was improved with implantation time in both scaffold groups. The multilayer group got significantly higher scores than the PCL group on both bone filling and bone morphology in subchondral bone region (at week 6), as well as cartilage morphology, cartilage thickness, and glycosaminoglycan & chondrocyte content (GAG & Cell) of neocartilage in cartilage region (at week 12). Data are shown as mean ± standard deviation. (*) indicates a significant difference between groups (p < 0.05), (#) indicates a significant difference between different time points for the same group (p < 0.05). The value of the intraclass correlation coefficient (ICC) was 0.853.